 ++++
++++Notebook converted from Jupyter for blog publishing.
03-PCA-Exercise-Project-Solutions
Principal Component Analysis - Project Exercise Solutions
GOAL: Figure out which handwritten digits are most differentiated with PCA.
Imagine you are working on an image recognition service for a postal service. It would be very useful to be able to read in the digits automatically, even if they are handwritten. (Quick note, this is very much how modern postal services work for a long time now and its actually more accurate than a human). The manager of the postal service wants to know which handwritten numbers are the hardest to tell apart, so he can focus on getting more labeled examples of that data. You will have a dataset of hand written digits (a very famous data set) and you will perform PCA to get better insight into which numbers are easily separable from the rest.
Data
Background:
E. Alpaydin, Fevzi. Alimoglu Department of Computer Engineering Bogazici University, 80815 Istanbul Turkey alpaydin '@' boun.edu.tr
Data Set Information from Original Authors:
We create a digit database by collecting 250 samples from 44 writers. The samples written by 30 writers are used for training, cross-validation and writer dependent testing, and the digits written by the other 14 are used for writer independent testing. This database is also available in the UNIPEN format.
We use a WACOM PL-100V pressure sensitive tablet with an integrated LCD display and a cordless stylus. The input and display areas are located in the same place. Attached to the serial port of an Intel 486 based PC, it allows us to collect handwriting samples. The tablet sends and tablet coordinates and pressure level values of the pen at fixed time intervals (sampling rate) of 100 miliseconds.
These writers are asked to write 250 digits in random order inside boxes of 500 by 500 tablet pixel resolution. Subject are monitored only during the first entry screens. Each screen contains five boxes with the digits to be written displayed above. Subjects are told to write only inside these boxes. If they make a mistake or are unhappy with their writing, they are instructed to clear the content of a box by using an on-screen button. The first ten digits are ignored because most writers are not familiar with this type of input devices, but subjects are not aware of this.
Complete the Tasks in bold below
TASK: Run the cells below to import the libraries and relevant data set.
import numpy as np
import pandas as pd
import matplotlib.pyplot as plt
import seaborn as sns
digits = pd.read_csv('../DATA/digits.csv')digitspixel_0_0
pixel_0_1
pixel_0_2
pixel_0_3
pixel_0_4TASK: Create a new DataFrame called pixels that consists only of the pixel feature values by dropping the number_label column.
#CODE HEREpixels = digits.drop('number_label',axis=1)pixelspixel_0_0
pixel_0_1
pixel_0_2
pixel_0_3
pixel_0_4Displaying an Image
TASK: Grab a single image row representation by getting the first row of the pixels DataFrame.
#CODE HEREsingle_image = pixels.iloc[0]single_imagepixel_0_0 0.0
pixel_0_1 0.0
pixel_0_2 5.0
pixel_0_3 13.0
pixel_0_4 9.0TASK: Convert this single row Series into a numpy array.
#CODE HEREsingle_image.to_numpy()array([ 0., 0., 5., 13., 9., 1., 0., 0., 0., 0., 13., 15., 10.,
15., 5., 0., 0., 3., 15., 2., 0., 11., 8., 0., 0., 4.,
12., 0., 0., 8., 8., 0., 0., 5., 8., 0., 0., 9., 8.,
0., 0., 4., 11., 0., 1., 12., 7., 0., 0., 2., 14., 5.,
10., 12., 0., 0., 0., 0., 6., 13., 10., 0., 0., 0.])TASK: Reshape this numpy array into an (8,8) array.
#CODE HEREsingle_image.to_numpy().shape(64,)single_image.to_numpy().reshape(8,8)array([[ 0., 0., 5., 13., 9., 1., 0., 0.],
[ 0., 0., 13., 15., 10., 15., 5., 0.],
[ 0., 3., 15., 2., 0., 11., 8., 0.],
[ 0., 4., 12., 0., 0., 8., 8., 0.],
[ 0., 5., 8., 0., 0., 9., 8., 0.],TASK: Use Matplotlib or Seaborn to display the array as an image representation of the number drawn. Remember your palette or cmap choice would change the colors, but not the actual pixel values.
#CODE HEREplt.imshow(single_image.to_numpy().reshape(8,8))<matplotlib.image.AxesImage at 0x1d45ca0e608>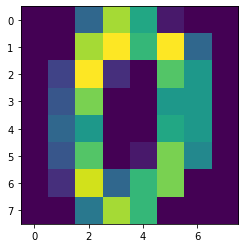
plt.imshow(single_image.to_numpy().reshape(8,8),cmap='gray')<matplotlib.image.AxesImage at 0x1d45c508f88>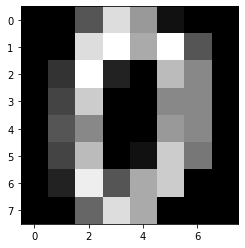
sns.heatmap(single_image.to_numpy().reshape(8,8),annot=True,cmap='gray')<AxesSubplot:>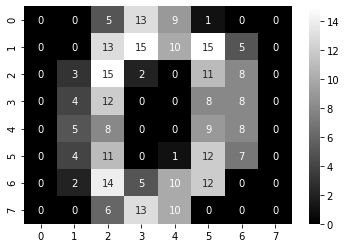
Now let's move on to PCA.
Scaling Data
TASK: Use Scikit-Learn to scale the pixel feature dataframe.
#CODE HEREfrom sklearn.preprocessing import StandardScalerscaler = StandardScaler()scaled_pixels = scaler.fit_transform(pixels)scaled_pixelsarray([[ 0. , -0.33501649, -0.04308102, ..., -1.14664746,
-0.5056698 , -0.19600752],
[ 0. , -0.33501649, -1.09493684, ..., 0.54856067,
-0.5056698 , -0.19600752],
[ 0. , -0.33501649, -1.09493684, ..., 1.56568555,PCA
TASK: Perform PCA on the scaled pixel data set with 2 components.
from sklearn.decomposition import PCApca_model = PCA(n_components=2)pca_pixels = pca_model.fit_transform(scaled_pixels)TASK: How much variance is explained by 2 principal components.
#CODE HEREnp.sum(pca_model.explained_variance_ratio_)0.21594970492246052TASK: Create a scatterplot of the digits in the 2 dimensional PCA space, color/label based on the original number_label column in the original dataset.
#CODE HEREplt.figure(figsize=(10,6),dpi=150)
labels = digits['number_label'].values
sns.scatterplot(pca_pixels[:,0],pca_pixels[:,1],hue=labels,palette='Set1')
plt.legend(loc=(1.05,0))<matplotlib.legend.Legend at 0x1d45c6c33c8>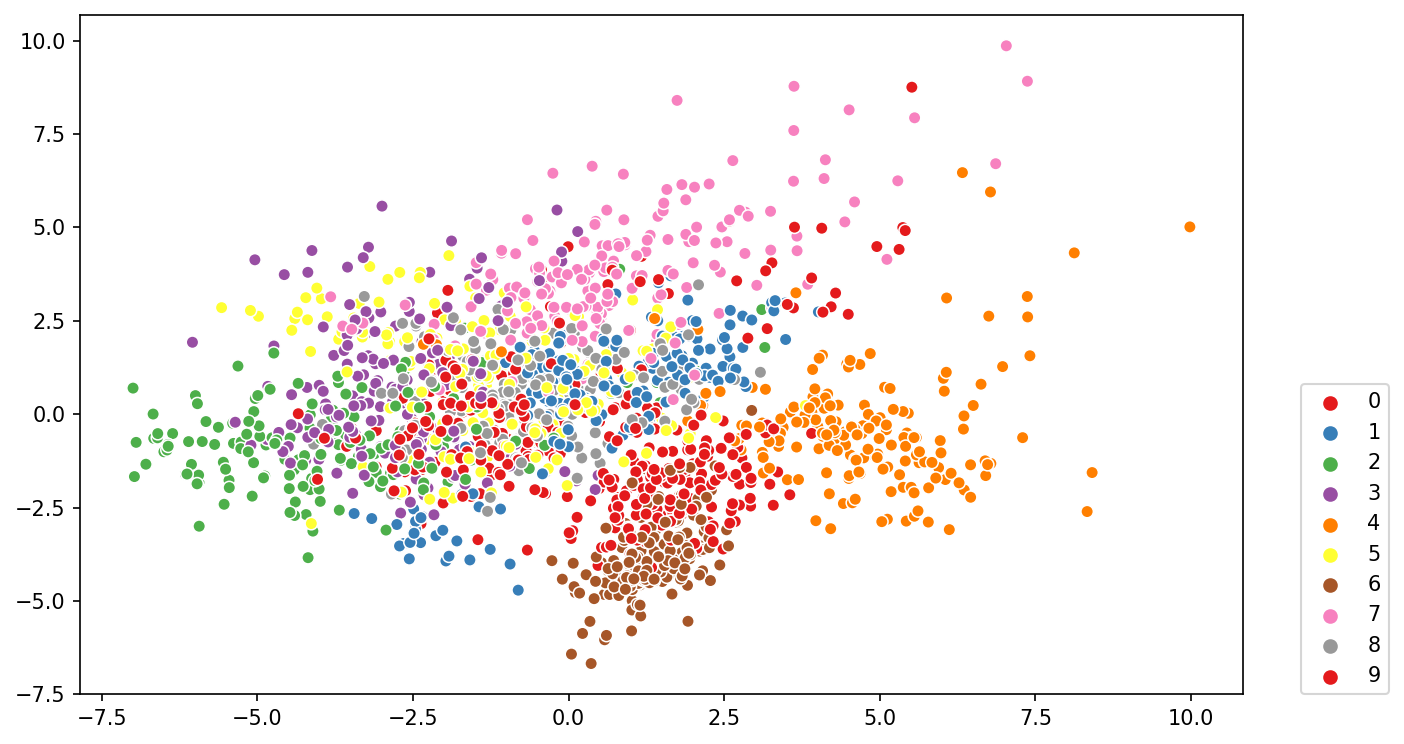
TASK: Which numbers are the most "distinct"?
# You should see label #4 as being the most separated group,
# implying its the most distinct, similar situation for #2, #6 and #9.
Bonus Challenge
TASK: Create an "interactive" 3D plot of the result of PCA with 3 principal components. Lot's of ways to do this, including different libraries like plotly or bokeh, but you can actually do this just with Matplotlib and Jupyter Notebook. Search Google and StackOverflow if you get stuck, lots of solutions are posted online.
#CODE HEREfrom sklearn.decomposition import PCApca_model = PCA(n_components=3)pca_pixels = pca_model.fit_transform(scaled_pixels)from mpl_toolkits import mplot3dplt.figure(figsize=(8,8),dpi=150)
ax = plt.axes(projection='3d')
ax.scatter3D(pca_pixels[:,0],pca_pixels[:,1],pca_pixels[:,2],c=df['number_label']);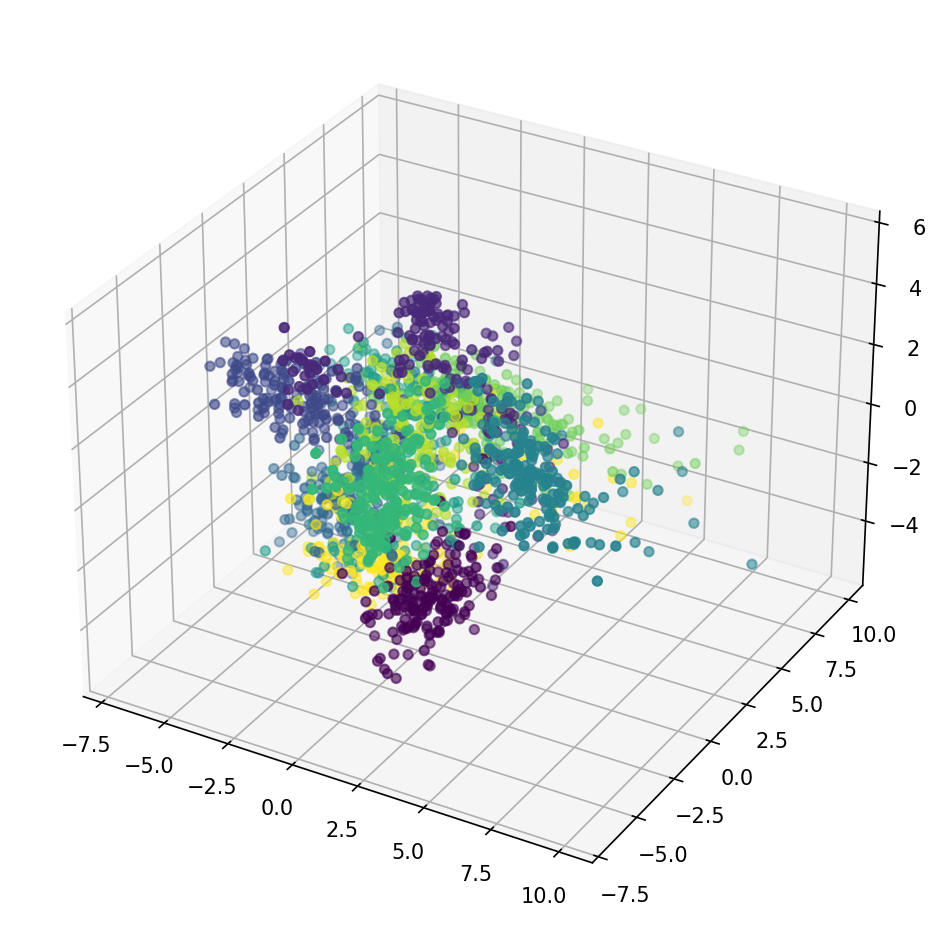
%matplotlib notebookax = plt.axes(projection='3d')
ax.scatter3D(pca_pixels[:,0],pca_pixels[:,1],pca_pixels[:,2],c=df['number_label']);<IPython.core.display.Javascript object>