++++
++++Notebook converted from Jupyter for blog publishing.
02-Matplotlib-SubPlots
Import the matplotlib.pyplot{:python} module under the name plt{:python} (the tidy way):
# COMMON MISTAKE!
# DON'T FORGET THE .PYPLOT part

import matplotlib.pyplot as plt
NOTE: For users running .py scripts in an IDE like PyCharm or Sublime Text Editor. You will not see the plots in a notebook, instead if you are using another editor, you'll use: plt.show() at the end of all your plotting commands to have the figure pop up in another window.
The Data
import numpy as npa = np.linspace(0,10,11)
b = a ** 4aarray([ 0., 1., 2., 3., 4., 5., 6., 7., 8., 9., 10.])barray([0.000e+00, 1.000e+00, 1.600e+01, 8.100e+01, 2.560e+02, 6.250e+02,
1.296e+03, 2.401e+03, 4.096e+03, 6.561e+03, 1.000e+04])x = np.arange(0,10)
y = 2 * xxarray([0, 1, 2, 3, 4, 5, 6, 7, 8, 9])yarray([ 0, 2, 4, 6, 8, 10, 12, 14, 16, 18])plt.subplots()
NOTE: Make sure you put the commands all together in the same cell as we do in this notebook and video!
The plt.subplots() object will act as a more automatic axis manager. This makes it much easier to show multiple plots side by side.
Note how we use tuple unpacking to grba both the Figure object and a numpy array of axes:
# Use similar to plt.figure() except use tuple unpacking to grab fig and axes
fig, axes = plt.subplots()

# Now use the axes object to add stuff to plot
axes.plot(x, y, 'r')
axes.set_xlabel('x')
axes.set_ylabel('y')
axes.set_title('title'); #; hides Out[]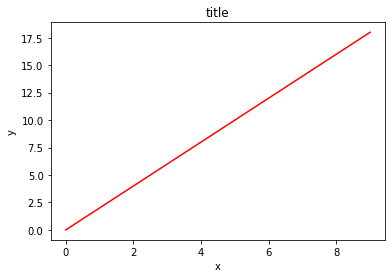
Adding rows and columns
Then you can specify the number of rows and columns when creating the subplots() object:
# Empty canvas of 1 by 2 subplots
fig, axes = plt.subplots(nrows=1, ncols=2)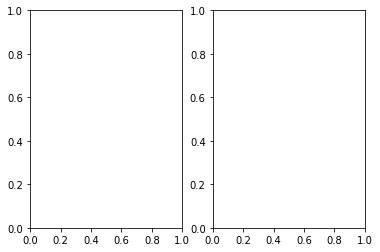
# Axes is an array of axes to plot on
axesarray([<matplotlib.axes._subplots.AxesSubplot object at 0x0000023521E20588>,
<matplotlib.axes._subplots.AxesSubplot object at 0x0000023521E5D8C8>],
dtype=object)axes.shape(2,)# Empty canvas of 2 by 2 subplots
fig, axes = plt.subplots(nrows=2, ncols=2)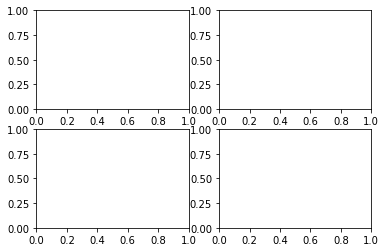
axesarray([[<matplotlib.axes._subplots.AxesSubplot object at 0x0000023521ED5E48>,
<matplotlib.axes._subplots.AxesSubplot object at 0x0000023521F09D88>],
[<matplotlib.axes._subplots.AxesSubplot object at 0x0000023521F45308>,
<matplotlib.axes._subplots.AxesSubplot object at 0x0000023521F79D88>]],
dtype=object)axes.shape(2, 2)Plotting on axes objects
Just as before, we simple .plot() on the axes objects, and we can also use the .set_ methods on each axes.
Let's explore this, make sure this is all in the same cell:
fig,axes = plt.subplots(nrows=1,ncols=2)

for axe in axes:
    axe.plot(x,y)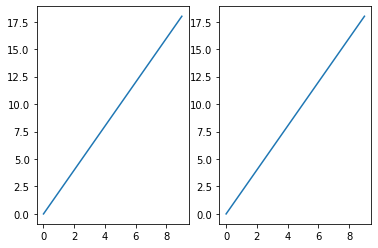
fig,axes = plt.subplots(nrows=1,ncols=2)

axes[0].plot(a,b)
axes[1].plot(x,y)[<matplotlib.lines.Line2D at 0x2352216ce88>]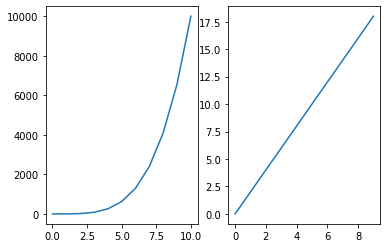
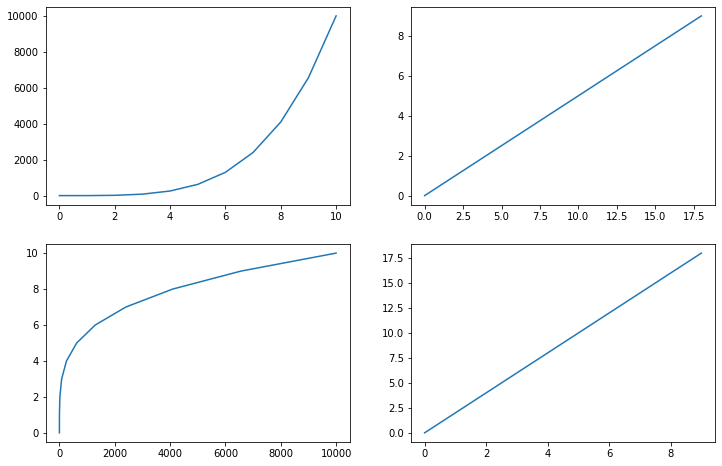
# NOTE! This returns 2 dimensional array
fig,axes = plt.subplots(nrows=2,ncols=2)

axes[0][0].plot(a,b)
axes[1][1].plot(x,y)[<matplotlib.lines.Line2D at 0x2352229c648>]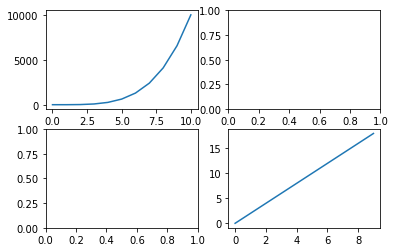
A common issue with matplolib is overlapping subplots or figures. We ca use fig.tight_layout() or plt.tight_layout() method, which automatically adjusts the positions of the axes on the figure canvas so that there is no overlapping content:
# NOTE! This returns 2 dimensional array
fig,axes = plt.subplots(nrows=2,ncols=2)

axes[0][0].plot(a,b)
axes[1][1].plot(x,y)

plt.tight_layout()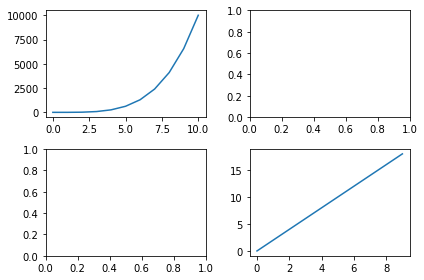
Parameters on subplots()
Recall we have both the Figure object and the axes. Meaning we can edit properties at both levels.
fig,axes = plt.subplots(nrows=2,ncols=2,figsize=(12,8))

# SET YOUR AXES PARAMETERS FIRST

# Parameters at the axes level
axes[0][0].plot(a,b)
axes[0][0].set_title('0 0 Title')


axes[1][1].plot(x,y)
axes[1][1].set_title('1 1 Title')
axes[1][1].set_xlabel('1 1 X Label')

axes[0][1].plot(y,x)
axes[1][0].plot(b,a)

# THEN SET OVERALL FIGURE PARAMETERS

# Parameters at the Figure level
fig.suptitle("Figure Level",fontsize=16)


plt.show()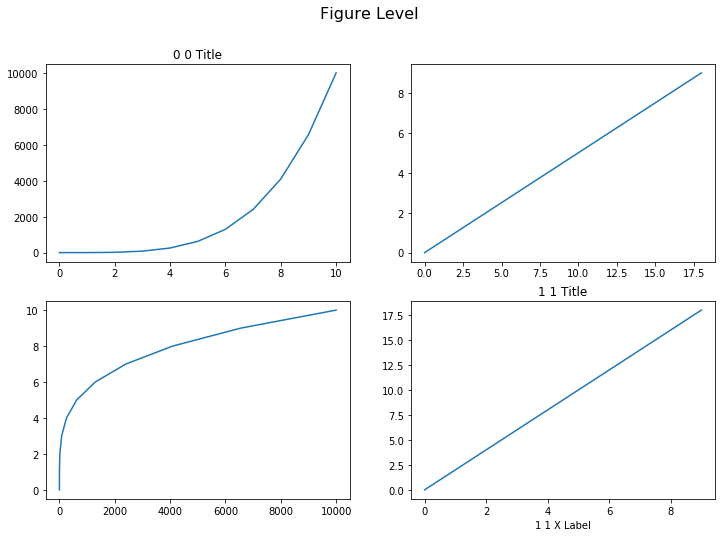
Manual spacing on subplots()
Use .subplots_adjust to adjust spacing manually.
Full Details Here: https://matplotlib.org/3.2.2/api/_as_gen/matplotlib.pyplot.subplots_adjust.html (opens in a new tab)
Example from link:
- left = 0.125 # the left side of the subplots of the figure
- right = 0.9 # the right side of the subplots of the figure
- bottom = 0.1 # the bottom of the subplots of the figure
- top = 0.9 # the top of the subplots of the figure
- wspace = 0.2 # the amount of width reserved for space between subplots,
expressed as a fraction of the average axis width
- hspace = 0.2 # the amount of height reserved for space between subplots,
expressed as a fraction of the average axis height
fig,axes = plt.subplots(nrows=2,ncols=2,figsize=(12,8))

# Parameters at the axes level
axes[0][0].plot(a,b)
axes[1][1].plot(x,y)
axes[0][1].plot(y,x)
axes[1][0].plot(b,a)

# Use left,right,top, bottom to stretch subplots
# Use wspace,hspace to add spacing between subplots
fig.subplots_adjust(left=None,
    bottom=None,
    right=None,
    top=None,
    wspace=0.9,
    hspace=0.1,)

plt.show()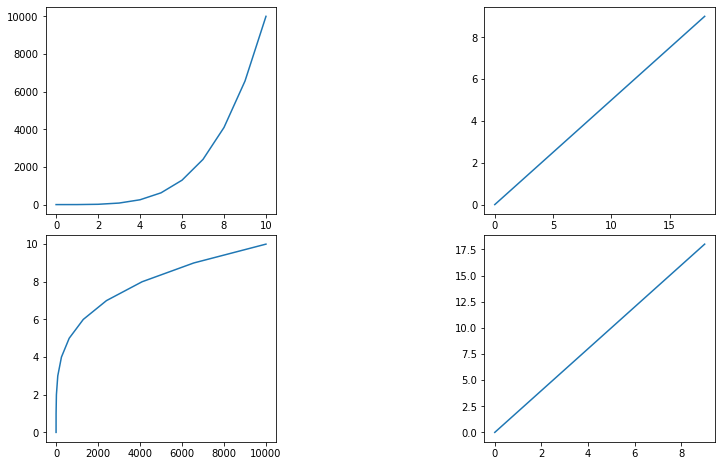
Exporting plt.subplots()
# NOTE! This returns 2 dimensional array
fig,axes = plt.subplots(nrows=2,ncols=2,figsize=(12,8))

axes[0][0].plot(a,b)
axes[1][1].plot(x,y)
axes[0][1].plot(y,x)
axes[1][0].plot(b,a)

fig.savefig('subplots.png',bbox_inches='tight')

plt.show()