 ++++
++++Notebook converted from Jupyter for blog publishing.
01-Dealing-with-Missing-Data
Dealing with Missing Data
We already reviewed Pandas operations for missing data, now let's apply this to clean a real data file. Keep in mind, there is no 100% correct way of doing this, and this notebook just serves as an example of some reasonable approaches to take on this data.
Note: Throughout this section we will be slowly cleaning and adding features to the Ames Housing Dataset for use in the next section. Make sure to always be loading the same file name as in the notebook.
2nd Note: Some of the methods shown here may not lead to optimal performance, but instead are shown to display examples of various methods available.
Imports
import numpy as np
import pandas as pd
import matplotlib.pyplot as plt
import seaborn as sns
with open('../DATA/Ames_Housing_Feature_Description.txt','r') as f:
print(f.read())MSSubClass: Identifies the type of dwelling involved in the sale.
20 1-STORY 1946 & NEWER ALL STYLES
30 1-STORY 1945 & OLDER
40 1-STORY W/FINISHED ATTIC ALL AGESData
df = pd.read_csv("../DATA/Ames_outliers_removed.csv")df.head()PID
MS SubClass
MS Zoning
Lot Frontage
Lot Arealen(df.columns)81df.info()<class 'pandas.core.frame.DataFrame'>
RangeIndex: 2927 entries, 0 to 2926
Data columns (total 81 columns):
# Column Non-Null Count Dtype
--- ------ -------------- ----- Removing the PID
We already have an index, so we don't need the PID unique identifier for the regression we will perform later on.
df = df.drop('PID',axis=1)len(df.columns)80Observing NaN Features
df.isnull()MS SubClass
MS Zoning
Lot Frontage
Lot Area
Streetdf.isnull().sum()MS SubClass 0
MS Zoning 0
Lot Frontage 490
Lot Area 0
Street 0100* df.isnull().sum() / len(df)MS SubClass 0.00000
MS Zoning 0.00000
Lot Frontage 16.74069
Lot Area 0.00000
Street 0.00000def percent_missing(df):
percent_nan = 100* df.isnull().sum() / len(df)
percent_nan = percent_nan[percent_nan>0].sort_values()
return percent_nanpercent_nan = percent_missing(df)sns.barplot(x=percent_nan.index,y=percent_nan)
plt.xticks(rotation=90);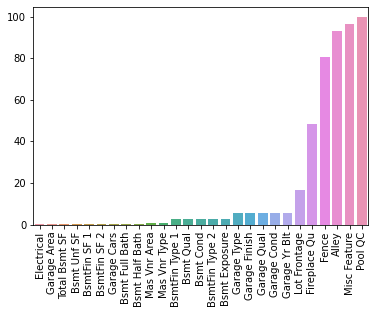
Removing Features or Removing Rows
If only a few rows relative to the size of your dataset are missing some values, then it might just be a good idea to drop those rows. What does this cost you in terms of performace? It essentialy removes potential training/testing data, but if its only a few rows, its unlikely to change performance.
Sometimes it is a good idea to remove a feature entirely if it has too many null values. However, you should carefully consider why it has so many null values, in certain situations null could just be used as a separate category.
Take for example a feature column for the number of cars that can fit into a garage. Perhaps if there is no garage then there is a null value, instead of a zero. It probably makes more sense to quickly fill the null values in this case with a zero instead of a null. Only you can decide based off your domain expertise and knowledge of the data set!
Working based on Rows Missing Data
Filling in Data or Dropping Data?
Let's explore how to choose to remove or fill in missing data for rows that are missing some data. Let's choose some threshold where we decide it is ok to drop a row if its missing some data (instead of attempting to fill in that missing data point). We will choose 1% as our threshold. This means if less than 1% of the rows are missing this feature, we will consider just dropping that row, instead of dealing with the feature itself. There is no right answer here, just use common sense and your domain knowledge of the dataset, obviously you don't want to drop a very high threshold like 50% , you should also explore correlation to the dataset, maybe it makes sense to drop the feature instead.
Based on the text description of the features, you will see that most of this missing data is actually NaN on purpose as a placeholder for 0 or "none".
Example of Filling in Data : Basement Columns
sns.barplot(x=percent_nan.index,y=percent_nan)
plt.xticks(rotation=90);
# Set 1% Threshold
plt.ylim(0,1)(0.0, 1.0)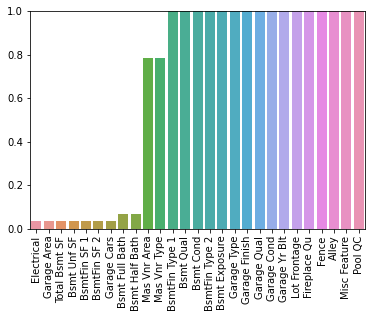
Let's drop or fill the rows based on this data. You could either manually fill in the data (especially the Basement data based on the description text file) OR you could simply drop the row and not consider it. Watch the video for a full explanation of this, in reality it probably makes more sense to fill in the Missing Basement data since its well described in the text description.
# Could also imply we should ex
percent_nan[percent_nan < 1]Electrical 0.034165
Garage Area 0.034165
Total Bsmt SF 0.034165
Bsmt Unf SF 0.034165
BsmtFin SF 1 0.034165100/len(df)0.0341646737273659df[df['Total Bsmt SF'].isnull()]MS SubClass
MS Zoning
Lot Frontage
Lot Area
Streetdf[df['Bsmt Half Bath'].isnull()]MS SubClass
MS Zoning
Lot Frontage
Lot Area
StreetFilling in data based on column names. There are 2 types of basement features, numerical and string descriptives.
The numerical basement columns:
bsmt_num_cols = ['BsmtFin SF 1', 'BsmtFin SF 2', 'Bsmt Unf SF','Total Bsmt SF', 'Bsmt Full Bath', 'Bsmt Half Bath']
df[bsmt_num_cols] = df[bsmt_num_cols].fillna(0)
The string basement columns:
bsmt_str_cols =  ['Bsmt Qual', 'Bsmt Cond', 'Bsmt Exposure', 'BsmtFin Type 1', 'BsmtFin Type 2']
df[bsmt_str_cols] = df[bsmt_str_cols].fillna('None')
percent_nan = percent_missing(df)sns.barplot(x=percent_nan.index,y=percent_nan)
plt.xticks(rotation=90);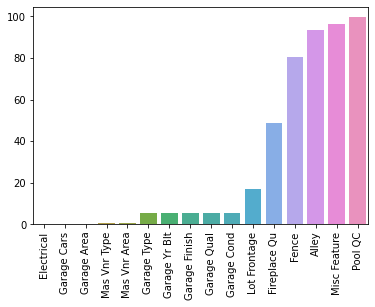
Dropping Rows
A few of these features appear that it is just one or two rows missing the data. Based on our description .txt file of the dataset, we could also fill in these data points easily, and that is the more correct approach, but here we show how to drop in case you find yourself in a situation where it makes more sense to drop a row, based on missing column features.
df.dropna() --- subset : array-like, optional Labels along other axis to consider, e.g. if you are dropping rows these would be a list of columns to include.
df = df.dropna(axis=0,subset= ['Electrical','Garage Cars'])percent_nan = percent_missing(df)sns.barplot(x=percent_nan.index,y=percent_nan)
plt.xticks(rotation=90);
plt.ylim(0,1)(0.0, 1.0)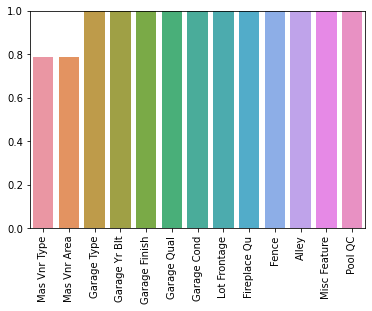
Mas Vnr Feature
Based on the Description Text File, Mas Vnr Type and Mas Vnr Area being missing (NaN) is likely to mean the house simply just doesn't have a masonry veneer, in which case, we will fill in this data as we did before.
df["Mas Vnr Type"] = df["Mas Vnr Type"].fillna("None")
df["Mas Vnr Area"] = df["Mas Vnr Area"].fillna(0)
percent_nan = percent_missing(df)sns.barplot(x=percent_nan.index,y=percent_nan)
plt.xticks(rotation=90);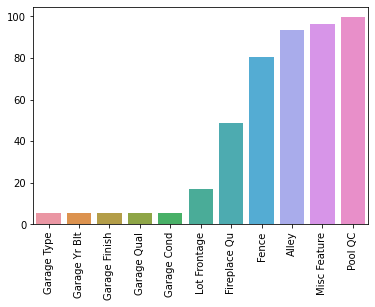
Filling In Missing Column Data
Our previous approaches were based more on rows missing data, now we will take an approach based on the column features themselves, since larger percentages of the data appears to be missing.
Garage Columns
Based on the data description, these NaN seem to indicate no garage, so we will substitute with "None" or 0.
df[['Garage Type', 'Garage Finish', 'Garage Qual', 'Garage Cond']]Garage Type
Garage Finish
Garage Qual
Garage Cond
0gar_str_cols = ['Garage Type', 'Garage Finish', 'Garage Qual', 'Garage Cond']
df[gar_str_cols] = df[gar_str_cols].fillna('None')df['Garage Yr Blt'] = df['Garage Yr Blt'].fillna(0)percent_nan = percent_missing(df)sns.barplot(x=percent_nan.index,y=percent_nan)
plt.xticks(rotation=90);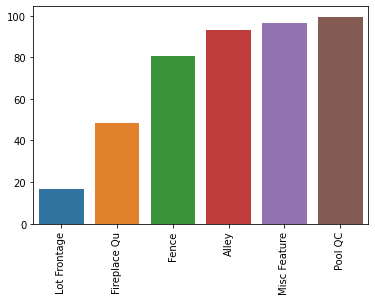
Dropping Feature Columns
Sometimes you may want to take the approach that above a certain missing percentage threshold, you will simply remove the feature from all the data. For example if 99% of rows are missing a feature, it will not be predictive, since almost all the data does not have any value for it. In our particular data set, many of these high percentage NaN features are actually plasceholders for "none" or 0. But for the sake of showing variations on dealing with missing data, we will remove these features, instead of filling them in with the appropriate value.
percent_nan.indexIndex(['Lot Frontage', 'Fireplace Qu', 'Fence', 'Alley', 'Misc Feature',
'Pool QC'],
dtype='object')df[['Lot Frontage', 'Fireplace Qu', 'Fence', 'Alley', 'Misc Feature','Pool QC']]Lot Frontage
Fireplace Qu
Fence
Alley
Misc Featuredf = df.drop(['Pool QC','Misc Feature','Alley','Fence'],axis=1)percent_nan = percent_missing(df)sns.barplot(x=percent_nan.index,y=percent_nan)
plt.xticks(rotation=90);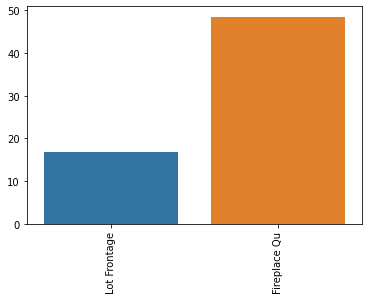
Filling in Fireplace Quality based on Description Text
df['Fireplace Qu'] = df['Fireplace Qu'].fillna("None")percent_nan = percent_missing(df)sns.barplot(x=percent_nan.index,y=percent_nan)
plt.xticks(rotation=90);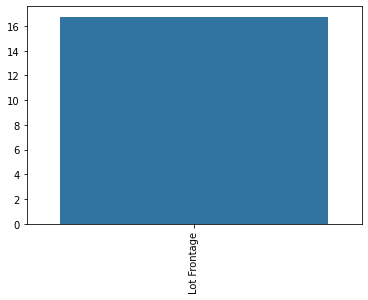
Imputation (opens in a new tab) of Missing Data
To impute missing data, we need to decide what other filled in (no NaN values) feature most probably relates and is correlated with the missing feature data. In this particular case we will use:
Neighborhood: Physical locations within Ames city limits
LotFrontage: Linear feet of street connected to property
We will operate under the assumption that the Lot Frontage is related to what neighborhood a house is in.
df['Neighborhood'].unique()array(['NAmes', 'Gilbert', 'StoneBr', 'NWAmes', 'Somerst', 'BrDale',
'NPkVill', 'NridgHt', 'Blmngtn', 'NoRidge', 'SawyerW', 'Sawyer',
'Greens', 'BrkSide', 'OldTown', 'IDOTRR', 'ClearCr', 'SWISU',
'Edwards', 'CollgCr', 'Crawfor', 'Blueste', 'Mitchel', 'Timber',
'MeadowV', 'Veenker', 'GrnHill', 'Landmrk'], dtype=object)plt.figure(figsize=(8,12))
sns.boxplot(x='Lot Frontage',y='Neighborhood',data=df,orient='h')<AxesSubplot:xlabel='Lot Frontage', ylabel='Neighborhood'>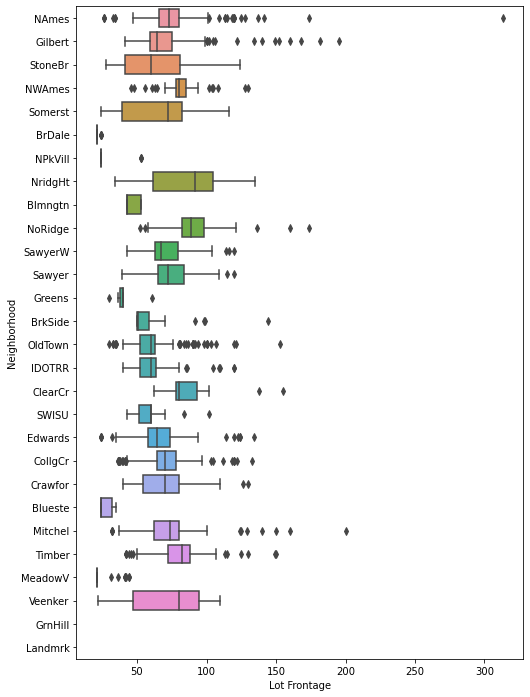
Impute Missing Data based on other Features
There are more complex methods, but usually the simpler the better, it avoids building models on top of other models.
More Info on Options: https://scikit-learn.org/stable/modules/impute.html (opens in a new tab)
df.groupby('Neighborhood')['Lot Frontage']<pandas.core.groupby.generic.SeriesGroupBy object at 0x00000211F18E23C8>df.groupby('Neighborhood')['Lot Frontage'].mean()Neighborhood
Blmngtn 46.900000
Blueste 27.300000
BrDale 21.500000
BrkSide 55.789474Transform Column
df.head()['Lot Frontage']0 141.0
1 80.0
2 81.0
3 93.0
4 74.0df[df['Lot Frontage'].isnull()]MS SubClass
MS Zoning
Lot Frontage
Lot Area
Streetdf.iloc[21:26]['Lot Frontage']21 85.0
22 NaN
23 NaN
24 NaN
25 65.0df.groupby('Neighborhood')['Lot Frontage'].transform(lambda val: val.fillna(val.mean()))0 141.000000
1 80.000000
2 81.000000
3 93.000000
4 74.000000df.groupby('Neighborhood')['Lot Frontage'].transform(lambda val: val.fillna(val.mean())).iloc[21:26]21 85.000000
22 64.549383
23 75.210667
24 75.210667
25 65.000000df['Lot Frontage'] = df.groupby('Neighborhood')['Lot Frontage'].transform(lambda val: val.fillna(val.mean()))percent_nan = percent_missing(df)sns.barplot(x=percent_nan.index,y=percent_nan)
plt.xticks(rotation=90);
df['Lot Frontage'] = df['Lot Frontage'].fillna(0)percent_nan = percent_missing(df)percent_nanSeries([], dtype: float64)Great! We no longer have any missing data in our entire data set! Keep in mind, we should eventually turn all these transformations into an easy to use function. For now, lets' save this dataset:
df.to_csv("../DATA/Ames_NO_Missing_Data.csv",index=False)