 ++++
++++Notebook converted from Jupyter for blog publishing.
00-Random-Forest-Classification
Random Forest - Classification
The Data
We will be using the same dataset through our discussions on classification with tree-methods (Decision Tree,Random Forests, and Gradient Boosted Trees) in order to compare performance metrics across these related models.
We will work with the "Palmer Penguins" dataset, as it is simple enough to help us fully understand how changing hyperparameters can change classification results.

Data were collected and made available by Dr. Kristen Gorman and the Palmer Station, Antarctica LTER, a member of the Long Term Ecological Research Network.
Gorman KB, Williams TD, Fraser WR (2014) Ecological Sexual Dimorphism and Environmental Variability within a Community of Antarctic Penguins (Genus Pygoscelis). PLoS ONE 9(3): e90081. doi:10.1371/journal.pone.0090081
Summary: The data folder contains two CSV files. For intro courses/examples, you probably want to use the first one (penguins_size.csv).
-
penguins_size.csv: Simplified data from original penguin data sets. Contains variables:
- species: penguin species (Chinstrap, Adélie, or Gentoo)
- culmen_length_mm: culmen length (mm)
- culmen_depth_mm: culmen depth (mm)
- flipper_length_mm: flipper length (mm)
- body_mass_g: body mass (g)
- island: island name (Dream, Torgersen, or Biscoe) in the Palmer Archipelago (Antarctica)
- sex: penguin sex
-
(Not used) penguins_lter.csv: Original combined data for 3 penguin species
Note: The culmen is "the upper ridge of a bird's beak"
Our goal is to create a model that can help predict a species of a penguin based on physical attributes, then we can use that model to help researchers classify penguins in the field, instead of needing an experienced biologist
Imports
import numpy as np
import pandas as pd
import matplotlib.pyplot as plt
import seaborn as sns
df = pd.read_csv("../DATA/penguins_size.csv")df = df.dropna()
df.head()species
island
culmen_length_mm
culmen_depth_mm
flipper_length_mmTrain | Test Split
X = pd.get_dummies(df.drop('species',axis=1),drop_first=True)
y = df['species']
from sklearn.model_selection import train_test_splitX_train, X_test, y_train, y_test = train_test_split(X, y, test_size=0.3, random_state=101)Random Forest Classification
from sklearn.ensemble import RandomForestClassifierhelp(RandomForestClassifier)Help on class RandomForestClassifier in module sklearn.ensemble._forest:
class RandomForestClassifier(ForestClassifier)
| RandomForestClassifier(n_estimators=100, *, criterion='gini', max_depth=None, min_samples_split=2, min_samples_leaf=1, min_weight_fraction_leaf=0.0, max_features='auto', max_leaf_nodes=None, min_impurity_decrease=0.0, min_impurity_split=None, bootstrap=True, oob_score=False, n_jobs=None, random_state=None, verbose=0, warm_start=False, class_weight=None, ccp_alpha=0.0, max_samples=None)
| # Use 10 random trees
model = RandomForestClassifier(n_estimators=10,max_features='auto',random_state=101)model.fit(X_train,y_train)RandomForestClassifier(n_estimators=10, random_state=101)preds = model.predict(X_test)Evaluation
from sklearn.metrics import confusion_matrix,classification_report,plot_confusion_matrix,accuracy_scoreconfusion_matrix(y_test,preds)array([[39, 2, 0],
[ 1, 22, 0],
[ 0, 0, 37]], dtype=int64)plot_confusion_matrix(model,X_test,y_test)<sklearn.metrics._plot.confusion_matrix.ConfusionMatrixDisplay at 0x1384588b0d0>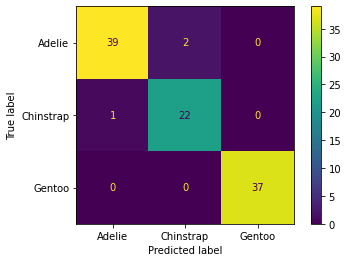
Feature Importance
Very useful attribute of the trained model!
model.feature_importances_array([0.35324545, 0.13320651, 0.1985798 , 0.12074795, 0.14244127,
0.03781403, 0.00677831, 0.00718669])Choosing correct number of trees
Let's explore if continually adding more trees improves performance...
test_error = []

for n in range(1,40):
    # Use n random trees
    model = RandomForestClassifier(n_estimators=n,max_features='auto')
    model.fit(X_train,y_train)
    test_preds = model.predict(X_test)
test_error.append(1-accuracy_score(test_preds,y_test))plt.plot(range(1,40),test_error,label='Test Error')
plt.legend()<matplotlib.legend.Legend at 0x138491ef760>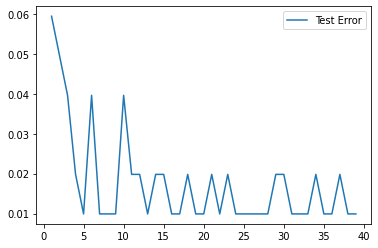
Clearly there are diminishing returns, on such a small dataset, we've pretty much extracted all the information we can after about 5 trees.
Random Forest - HyperParameter Exploration
https://archive.ics.uci.edu/ml/datasets/banknote+authentication (opens in a new tab)
df = pd.read_csv("../DATA/data_banknote_authentication.csv")df.head()Variance_Wavelet
Skewness_Wavelet
Curtosis_Wavelet
Image_Entropy
Classsns.pairplot(df,hue='Class')<seaborn.axisgrid.PairGrid at 0x13849319fa0>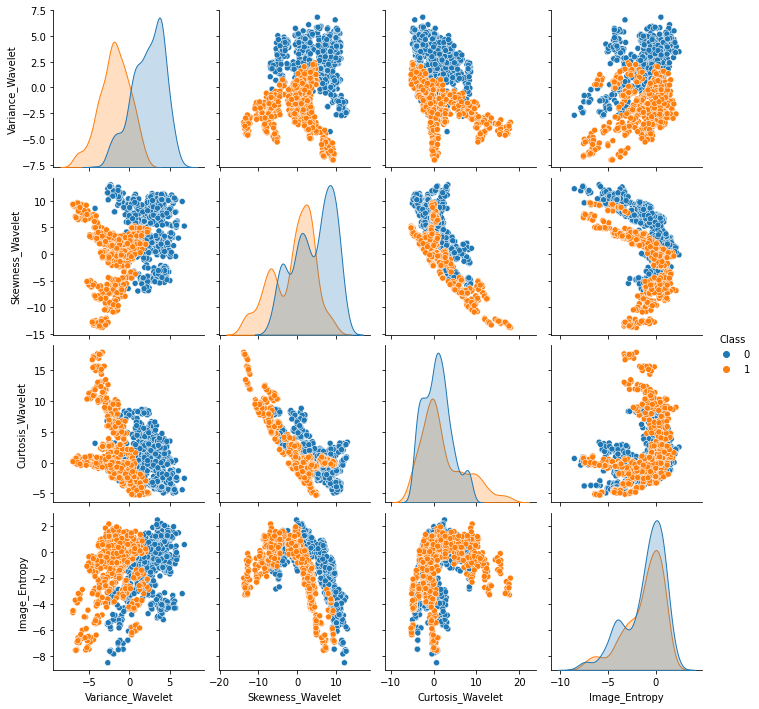
X = df.drop("Class",axis=1)y = df["Class"]from sklearn.model_selection import train_test_splitX_train, X_test, y_train, y_test = train_test_split(X, y, test_size=0.15, random_state=101)from sklearn.model_selection import GridSearchCVn_estimators=[64,100,128,200]
max_features= [2,3,4]
bootstrap = [True,False]
oob_score = [True,False]param_grid = {'n_estimators':n_estimators,
'max_features':max_features,
'bootstrap':bootstrap,
'oob_score':oob_score} # Note, oob_score only makes sense when bootstrap=True!rfc = RandomForestClassifier()
grid = GridSearchCV(rfc,param_grid)grid.fit(X_train,y_train)c:\users\marcial\anaconda_new\envs\ml_master\lib\site-packages\sklearn\model_selection\_validation.py:548: FitFailedWarning: Estimator fit failed. The score on this train-test partition for these parameters will be set to nan. Details:
Traceback (most recent call last):
File "c:\users\marcial\anaconda_new\envs\ml_master\lib\site-packages\sklearn\model_selection\_validation.py", line 531, in _fit_and_score
estimator.fit(X_train, y_train, **fit_params)
File "c:\users\marcial\anaconda_new\envs\ml_master\lib\site-packages\sklearn\ensemble\_forest.py", line 351, in fitGridSearchCV(estimator=RandomForestClassifier(oob_score=True),
param_grid={'bootstrap': [True, False], 'max_features': [2, 3, 4],
'n_estimators': [64, 100, 128, 200]})grid.best_params_{'bootstrap': True, 'max_features': 2, 'n_estimators': 64}predictions = grid.predict(X_test)print(classification_report(y_test,predictions)) precision recall f1-score support
0 1.00 0.98 0.99 124
1 0.98 1.00 0.99 82
plot_confusion_matrix(grid,X_test,y_test)<sklearn.metrics._plot.confusion_matrix.ConfusionMatrixDisplay at 0x138493358e0>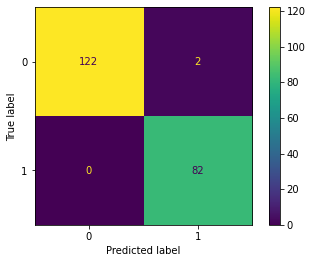
# No underscore, reports back original oob_score parameter
grid.best_estimator_.oob_scoreTrue# With underscore, reports back fitted attribute of oob_score
grid.best_estimator_.oob_score_0.9939965694682675Understanding Number of Estimators (Trees)
Let's plot out error vs. Number of Estimators
from sklearn.metrics import accuracy_scoreerrors = []
misclassifications = []
for n in range(1,64):
rfc = RandomForestClassifier( n_estimators=n,bootstrap=True,max_features= 2)
rfc.fit(X_train,y_train)
preds = rfc.predict(X_test)
err = 1 - accuracy_score(preds,y_test)
n_missed = np.sum(preds != y_test) # watch the video to understand this line!!
errors.append(err)
misclassifications.append(n_missed)plt.plot(range(1,64),errors)[<matplotlib.lines.Line2D at 0x13849748310>]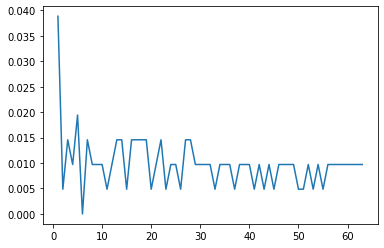
plt.plot(range(1,64),misclassifications)[<matplotlib.lines.Line2D at 0x13849791c10>]