++++
++++Data Science
May 2026×Notebook lesson
Notebook converted from Jupyter for blog publishing.
00-Hierarchical-Clustering
Driptanil DattaSoftware Developer
Hierarchal Clustering
import numpy as np
import pandas as pd
import matplotlib.pyplot as plt
import seaborn as sns
The Data
df = pd.read_csv('../DATA/cluster_mpg.csv')df = df.dropna()df.head()HTML
MORE
mpg
cylinders
displacement
horsepower
weightdf.describe()HTML
MORE
mpg
cylinders
displacement
horsepower
weightdf['origin'].value_counts()RESULT
usa       245
japan      79
europe     68
Name: origin, dtype: int64
df_w_dummies = pd.get_dummies(df.drop('name',axis=1))df_w_dummiesHTML
MORE
mpg
cylinders
displacement
horsepower
weight
from sklearn.preprocessing import MinMaxScalerscaler = MinMaxScaler()scaled_data = scaler.fit_transform(df_w_dummies)scaled_dataRESULT
MORE
array([[0.2393617 , 1. , 0.61757106, ..., 0. , 0. ,
1. ],
[0.15957447, 1. , 0.72868217, ..., 0. , 0. ,
1. ],
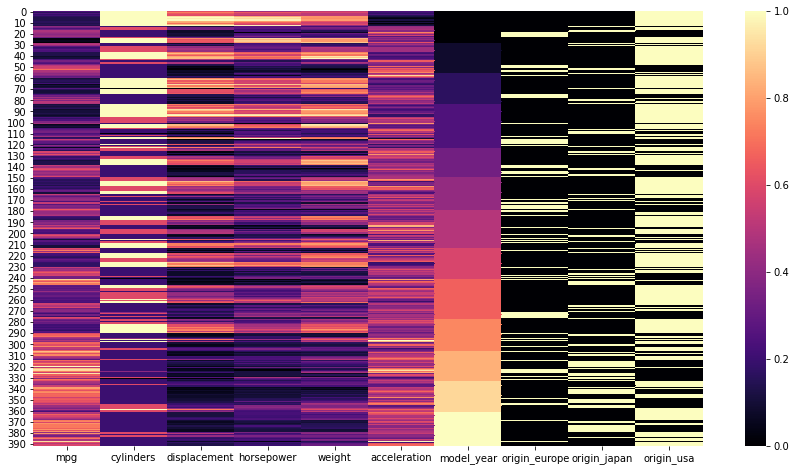
[0.2393617 , 1. , 0.64599483, ..., 0. , 0. ,scaled_df = pd.DataFrame(scaled_data,columns=df_w_dummies.columns)plt.figure(figsize=(15,8))
sns.heatmap(scaled_df,cmap='magma');PLOT
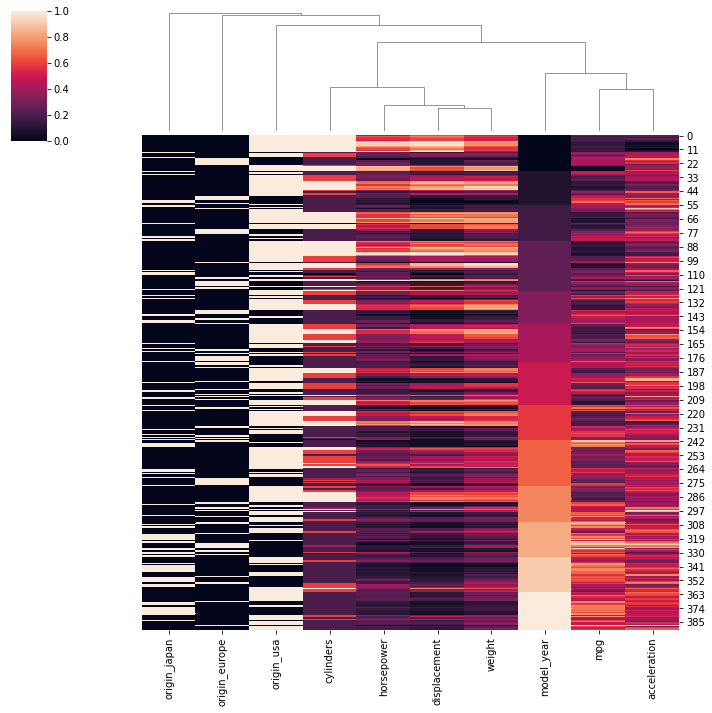
sns.clustermap(scaled_df,row_cluster=False)RESULT
<seaborn.matrix.ClusterGrid at 0x1a8a23ef2b0>PLOT
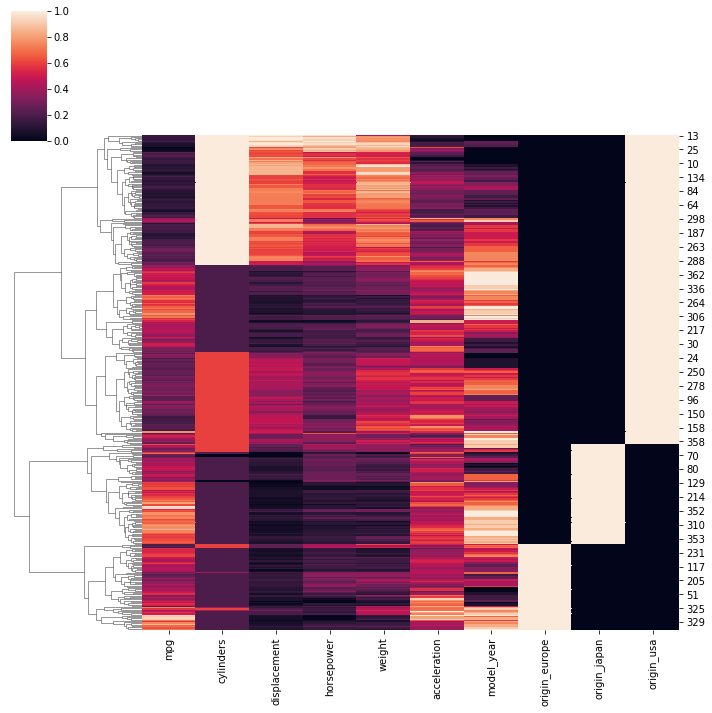
sns.clustermap(scaled_df,col_cluster=False)RESULT
<seaborn.matrix.ClusterGrid at 0x1a8a45f21c0>PLOT
Using Scikit-Learn
from sklearn.cluster import AgglomerativeClusteringmodel = AgglomerativeClustering(n_clusters=4)cluster_labels = model.fit_predict(scaled_df)cluster_labelsRESULT
MORE
array([1, 1, 1, 1, 1, 1, 1, 1, 1, 1, 1, 1, 1, 1, 3, 0, 0, 0, 3, 2, 2, 2,
       2, 2, 0, 1, 1, 1, 1, 3, 0, 3, 0, 0, 0, 0, 0, 1, 1, 1, 1, 1, 1, 1,
       0, 0, 0, 0, 0, 2, 2, 2, 3, 3, 2, 0, 3, 0, 2, 0, 0, 1, 1, 1, 1, 1,
       1, 1, 1, 1, 3, 1, 1, 1, 1, 2, 2, 2, 2, 0, 3, 3, 0, 3, 1, 1, 1, 1,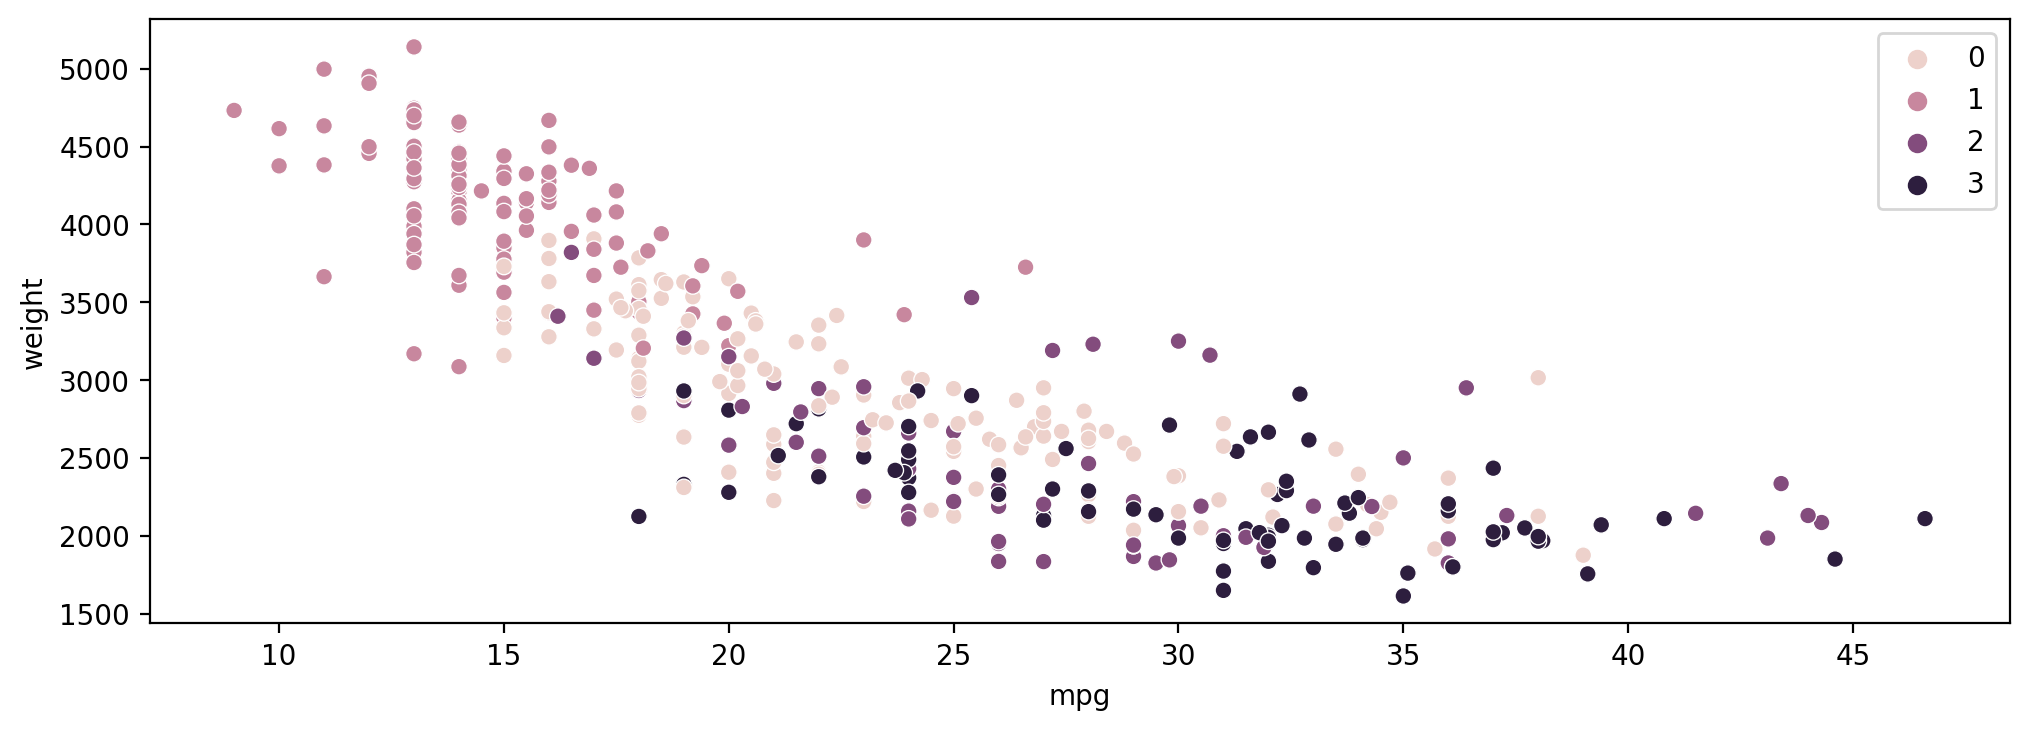
1, 1, 1, 1, 1, 1, 1, 1, 0, 0, 0, 0, 0, 2, 1, 1, 1, 1, 0, 3, 0, 3,plt.figure(figsize=(12,4),dpi=200)
sns.scatterplot(data=df,x='mpg',y='weight',hue=cluster_labels)RESULT
<AxesSubplot:xlabel='mpg', ylabel='weight'>PLOT
Exploring Number of Clusters with Dendrograms
Make sure to read the documentation online! https://docs.scipy.org/doc/scipy/reference/generated/scipy.cluster.hierarchy.dendrogram.html (opens in a new tab)
Assuming every point starts as its own cluster
model = AgglomerativeClustering(n_clusters=None,distance_threshold=0)cluster_labels = model.fit_predict(scaled_df)cluster_labelsRESULT
MORE
array([247, 252, 360, 302, 326, 381, 384, 338, 300, 279, 217, 311, 377,
       281, 232, 334, 272, 375, 354, 333, 317, 345, 329, 289, 305, 383,
       290, 205, 355, 269, 202, 144, 245, 297, 386, 358, 199, 337, 330,
       339, 293, 352, 283, 196, 253, 168, 378, 331, 201, 268, 256, 361,
       250, 197, 246, 371, 324, 230, 203, 261, 380, 376, 308, 389, 332,
from scipy.cluster.hierarchy import dendrogram
from scipy.cluster import hierarchyLinkage Model
linkage_matrix = hierarchy.linkage(model.children_)linkage_matrixRESULT
MORE
array([[ 67.        , 161.        ,   1.41421356,   2.        ],
       [ 10.        ,  45.        ,   1.41421356,   2.        ],
       [ 47.        ,  99.        ,   1.41421356,   2.        ],
       ...,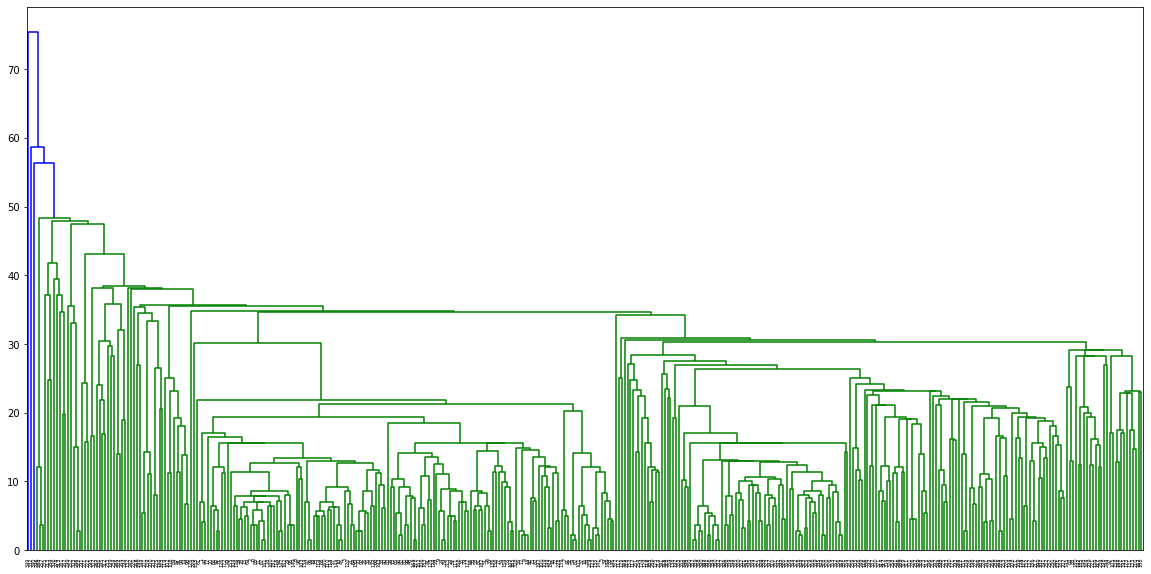
[340. , 777. , 56.40035461, 389. ],plt.figure(figsize=(20,10))
# Warning! This plot will take awhile!!
dn = hierarchy.dendrogram(linkage_matrix)PLOT
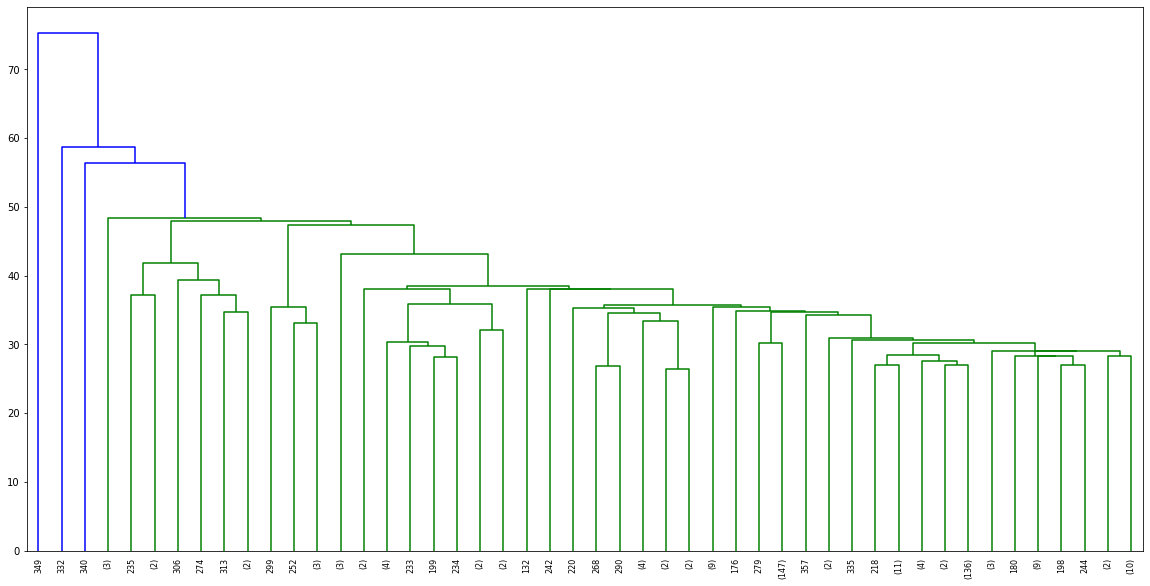
plt.figure(figsize=(20,10))
dn = hierarchy.dendrogram(linkage_matrix,truncate_mode='lastp',p=48)
PLOT
Choosing a Threshold Distance
What is the distance between two points?
scaled_df.describe()HTML
MORE
mpg
cylinders
displacement
horsepower
weightscaled_df['mpg'].idxmax()RESULT
320scaled_df['mpg'].idxmin()RESULT
28# https://stackoverflow.com/questions/1401712/how-can-the-euclidean-distance-be-calculated-with-numpy
a = scaled_df.iloc[320]
b = scaled_df.iloc[28]
dist = np.linalg.norm(a-b)distRESULT
2.3852929970374714Max possible distance?
Recall Euclidean distance: https://en.wikipedia.org/wiki/Euclidean_distance (opens in a new tab)
np.sqrt(len(scaled_df.columns))RESULT
3.1622776601683795Creating a Model Based on Distance Threshold
- distance_threshold
- The linkage distance threshold above which, clusters will not be merged.
model = AgglomerativeClustering(n_clusters=None,distance_threshold=2)cluster_labels = model.fit_predict(scaled_data)cluster_labelsRESULT
MORE
array([ 3,  3,  3,  3,  3,  3,  3,  3,  3,  3,  3,  3,  3,  3,  1,  4,  4,
        4,  1,  0,  0,  0,  0,  0,  4,  3,  3,  3,  3,  1,  7,  1,  4,  4,
        4,  4,  4,  3,  3,  3,  3,  3,  3,  3,  4,  7,  4,  4,  7,  0,  0,
        0,  1,  1,  0,  7,  1,  7,  0,  7,  7,  3,  3,  3,  3,  3,  3,  3,
3, 3, 1, 3, 3, 3, 3, 0, 0, 0, 0, 7, 1, 1, 7, 1, 3,np.unique(cluster_labels)RESULT
array([ 0, 1, 2, 3, 4, 5, 6, 7, 8, 9, 10], dtype=int64)Linkage Matrix
A (n-1) by 4 matrix Z is returned. At the i-th iteration, clusters with indices Z[i, 0] and Z[i, 1] are combined to form cluster n + i. A cluster with an index less than n corresponds to one of the original observations. The distance between clusters Z[i, 0] and Z[i, 1] is given by Z[i, 2]. The fourth value Z[i, 3] represents the number of original observations in the newly formed cluster.
linkage_matrix = hierarchy.linkage(model.children_)linkage_matrixRESULT
MORE
array([[ 67.        , 161.        ,   1.41421356,   2.        ],
       [ 10.        ,  45.        ,   1.41421356,   2.        ],
       [ 47.        ,  99.        ,   1.41421356,   2.        ],
       ...,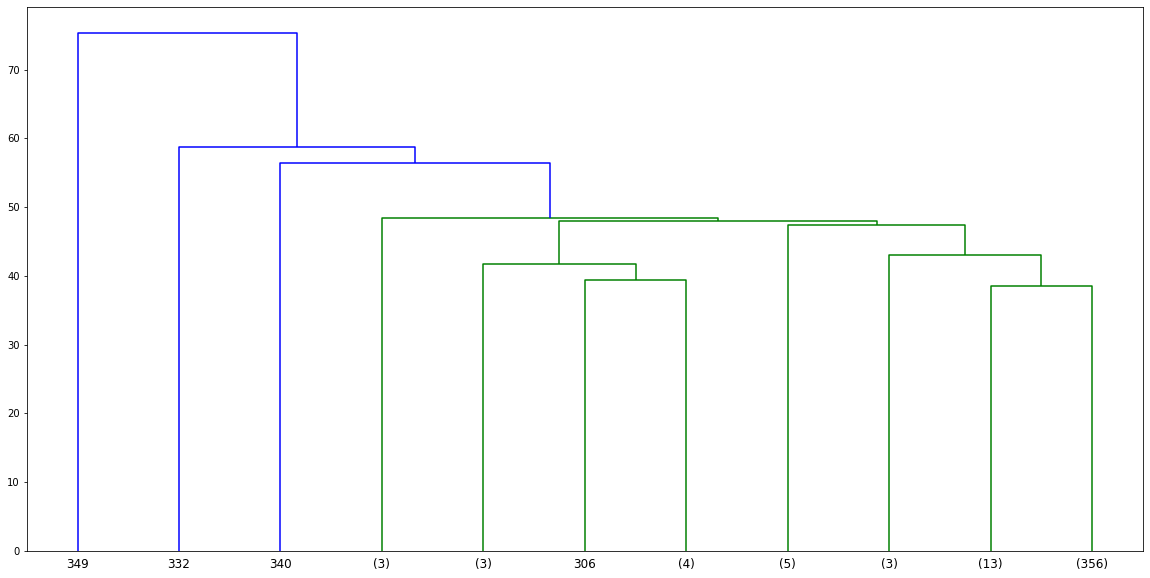
[340. , 777. , 56.40035461, 389. ],plt.figure(figsize=(20,10))
dn = hierarchy.dendrogram(linkage_matrix,truncate_mode='lastp',p=11)PLOT