++++
++++Notebook converted from Jupyter for blog publishing.
00-Matplotlib-Basics
Introduction
Matplotlib is the "grandfather" library of data visualization with Python. It was created by John Hunter. He created it to try to replicate MatLab's (another programming language) plotting capabilities in Python. So if you happen to be familiar with matlab, matplotlib will feel natural to you.
It is an excellent 2D and 3D graphics library for generating scientific figures.
Some of the major Pros of Matplotlib are:
- Generally easy to get started for simple plots
- Support for custom labels and texts
- Great control of every element in a figure
- High-quality output in many formats
- Very customizable in general
Matplotlib allows you to create reproducible figures programmatically. Let's learn how to use it! Before continuing this lecture, I encourage you just to explore the official Matplotlib web page: http://matplotlib.org/ (opens in a new tab)
Installation
If you are using our environment, its already installed for you. If you are not using our environment (not recommended), you'll need to install matplotlib first with either:
conda install matplotlib or
pip install matplotlib
Importing
Import the matplotlib.pyplot{:python} module under the name plt{:python} (the tidy way):
# COMMON MISTAKE!
# DON'T FORGET THE .PYPLOT part

import matplotlib.pyplot as plt
NOTE: If you are using an older version of jupyter, you need to run a "magic" command to see the plots inline with the notebook. Users of jupyter notebook 1.0 and above, don't need to run the cell below:
%matplotlib inlineNOTE: For users running .py scripts in an IDE like PyCharm or Sublime Text Editor. You will not see the plots in a notebook, instead if you are using another editor, you'll use: plt.show() at the end of all your plotting commands to have the figure pop up in another window.
Basic Example
Let's walk through a very simple example using two numpy arrays:
Basic Array Plot
Let's walk through a very simple example using two numpy arrays. You can also use lists, but most likely you'll be passing numpy arrays or pandas columns (which essentially also behave like arrays).
The data we want to plot:
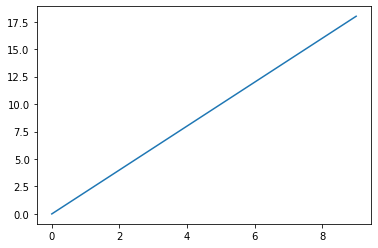
import numpy as npx = np.arange(0,10)y = 2*xxarray([0, 1, 2, 3, 4, 5, 6, 7, 8, 9])yarray([ 0, 2, 4, 6, 8, 10, 12, 14, 16, 18])Using Matplotlib with plt.plot() function calls
Basic Matplotlib Commands
We can create a very simple line plot using the following ( I encourage you to pause and use Shift+Tab along the way to check out the document strings for the functions we are using).
plt.plot(x, y)
plt.xlabel('X Axis Title Here')
plt.ylabel('Y Axis Title Here')
plt.title('String Title Here')
plt.show() # Required for non-jupyter users , but also removes Out[] info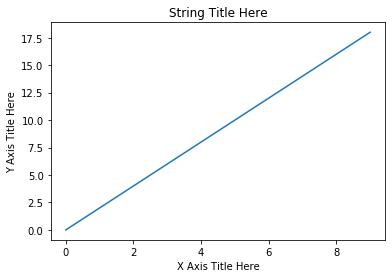
Editing more figure parameters
plt.plot(x, y)
plt.xlabel('X Axis Title Here')
plt.ylabel('Y Axis Title Here')
plt.title('String Title Here')
plt.xlim(0,6) # Lower Limit, Upper Limit
plt.ylim(0,12) # Lower Limit, Upper Limit
plt.show() # Required for non-jupyter users , but also removes Out[] info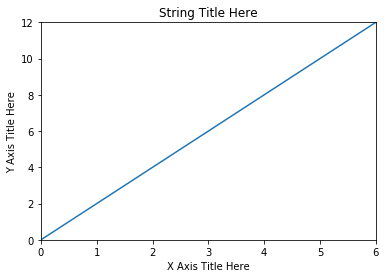
Exporting a plot
help(plt.savefig)Help on function savefig in module matplotlib.pyplot:
savefig(*args, **kwargs)
Save the current figure.
plt.plot(x,y)
plt.savefig('example.png')