 ++++
++++Notebook converted from Jupyter for blog publishing.
00-Dealing-with-Outliers
Dealing with Outliers
In statistics, an outlier is a data point that differs significantly from other observations.An outlier may be due to variability in the measurement or it may indicate experimental error; the latter are sometimes excluded from the data set. An outlier can cause serious problems in statistical analyses.
Remember that even if a data point is an outlier, its still a data point! Carefully consider your data, its sources, and your goals whenver deciding to remove an outlier. Each case is different!
Lecture Goals
- Understand different mathmatical definitions of outliers
- Use Python tools to recognize outliers and remove them
Useful Links
Imports
import numpy as np
import pandas as pd
import matplotlib.pyplot as plt
import seaborn as sns
Generating Data
# Choose a mean,standard deviation, and number of samples

def create_ages(mu=50,sigma=13,num_samples=100,seed=42):

    # Set a random seed in the same cell as the random call to get the same values as us
    # We set seed to 42 (42 is an arbitrary choice from Hitchhiker's Guide to the Galaxy)
    np.random.seed(seed)

    sample_ages = np.random.normal(loc=mu,scale=sigma,size=num_samples)
    sample_ages = np.round(sample_ages,decimals=0)

    return sample_ages
sample = create_ages()samplearray([56., 48., 58., 70., 47., 47., 71., 60., 44., 57., 44., 44., 53.,
25., 28., 43., 37., 54., 38., 32., 69., 47., 51., 31., 43., 51.,
35., 55., 42., 46., 42., 74., 50., 36., 61., 34., 53., 25., 33.,
53., 60., 52., 48., 46., 31., 41., 44., 64., 54., 27., 54., 45.,
41., 58., 63., 62., 39., 46., 54., 63., 44., 48., 36., 34., 61.,Visualize and Describe the Data
sns.distplot(sample,bins=10,kde=False)<AxesSubplot:>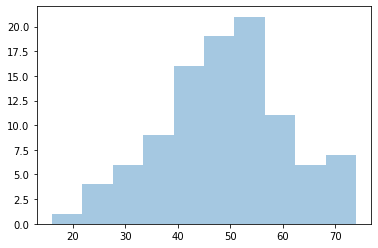
sns.boxplot(sample)<AxesSubplot:>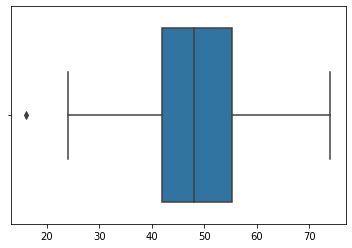
ser = pd.Series(sample)
ser.describe()count 100.00000
mean 48.66000
std 11.82039
min 16.00000
25% 42.00000Trimming or Fixing Based Off Domain Knowledge
If we know we're dealing with a dataset pertaining to voting age (18 years old in the USA), then it makes sense to either drop anything less than that OR fix values lower than 18 and push them up to 18.
ser[ser > 18]0 56.0
1 48.0
2 58.0
3 70.0
4 47.0# It dropped one person
len(ser[ser > 18])99def fix_values(age):
if age < 18:
return 18
else:
return age# "Fixes" one person's age
ser.apply(fix_values)0 56.0
1 48.0
2 58.0
3 70.0
4 47.0len(ser.apply(fix_values))100There are many ways to identify and remove outliers:
- Trimming based off a provided value
- Capping based off IQR or STD
- https://towardsdatascience.com/ways-to-detect-and-remove-the-outliers-404d16608dba (opens in a new tab)
- https://towardsdatascience.com/5-ways-to-detect-outliers-that-every-data-scientist-should-know-python-code-70a54335a623 (opens in a new tab)
Ames Data Set
Let's explore any extreme outliers in our Ames Housing Data Set
df = pd.read_csv("../DATA/Ames_Housing_Data.csv")df.head()PID
MS SubClass
MS Zoning
Lot Frontage
Lot Areasns.heatmap(df.corr())<AxesSubplot:>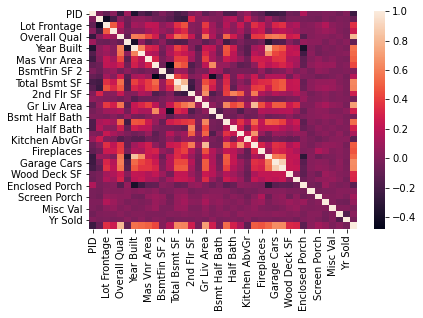
df.corr()['SalePrice'].sort_values()PID -0.246521
Enclosed Porch -0.128787
Kitchen AbvGr -0.119814
Overall Cond -0.101697
MS SubClass -0.085092sns.distplot(df["SalePrice"])<AxesSubplot:xlabel='SalePrice'>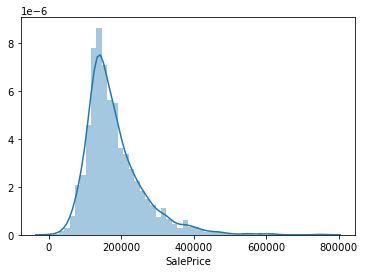
sns.scatterplot(x='Overall Qual',y='SalePrice',data=df)<AxesSubplot:xlabel='Overall Qual', ylabel='SalePrice'>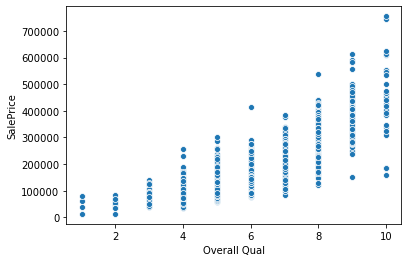
df[(df['Overall Qual']>8) & (df['SalePrice']<200000)]PID
MS SubClass
MS Zoning
Lot Frontage
Lot Areasns.scatterplot(x='Gr Liv Area',y='SalePrice',data=df)<AxesSubplot:xlabel='Gr Liv Area', ylabel='SalePrice'>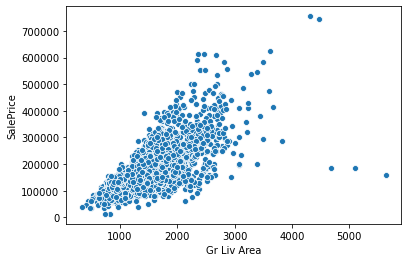
df[(df['Gr Liv Area']>4000) & (df['SalePrice']<400000)]PID
MS SubClass
MS Zoning
Lot Frontage
Lot Areadf[(df['Gr Liv Area']>4000) & (df['SalePrice']<400000)].indexInt64Index([1498, 2180, 2181], dtype='int64')ind_drop = df[(df['Gr Liv Area']>4000) & (df['SalePrice']<400000)].indexdf = df.drop(ind_drop,axis=0)sns.scatterplot(x='Gr Liv Area',y='SalePrice',data=df)<AxesSubplot:xlabel='Gr Liv Area', ylabel='SalePrice'>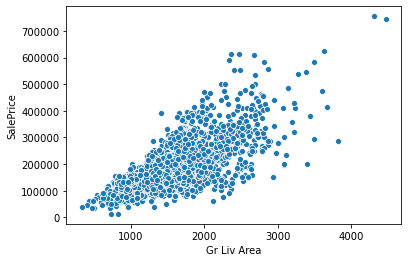
sns.scatterplot(x='Overall Qual',y='SalePrice',data=df)<AxesSubplot:xlabel='Overall Qual', ylabel='SalePrice'>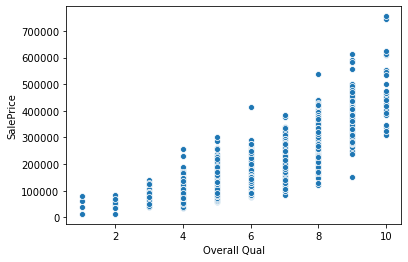
df.to_csv("../DATA/Ames_outliers_removed.csv",index=False)