++++
++++Data Science
May 2026×Notebook lesson
Notebook converted from Jupyter for blog publishing.
Untitled
Driptanil DattaSoftware Developer
import matplotlib.pyplot as pltplt.figure()RESULT
<Figure size 432x288 with 0 Axes>RESULT
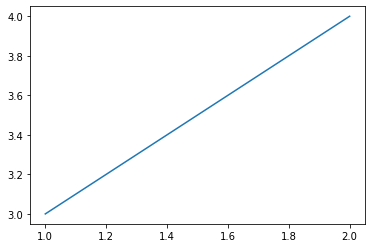
<Figure size 432x288 with 0 Axes>plt.plot([1,2],[3,4])RESULT
[<matplotlib.lines.Line2D at 0x206a7258d08>]PLOT
# Create Figure (empty canvas)
fig = plt.figure()

# Add set of axes to figure
axes = fig.add_axes([0, 0, 1, 1])
PLOT