 ++++
++++Notebook converted from Jupyter for blog publishing.
10-Pivot-Tables
Pivot Tables
Pivoting data can sometimes help clarify relationships and connections.
Full documentation on a variety of related pivot methods: https://pandas.pydata.org/docs/user_guide/reshaping.html (opens in a new tab)
Data
import numpy as np
import pandas as pd
df = pd.read_csv('Sales_Funnel_CRM.csv')dfAccount Number
Company
Contact
Account Manager
ProductThe pivot() method
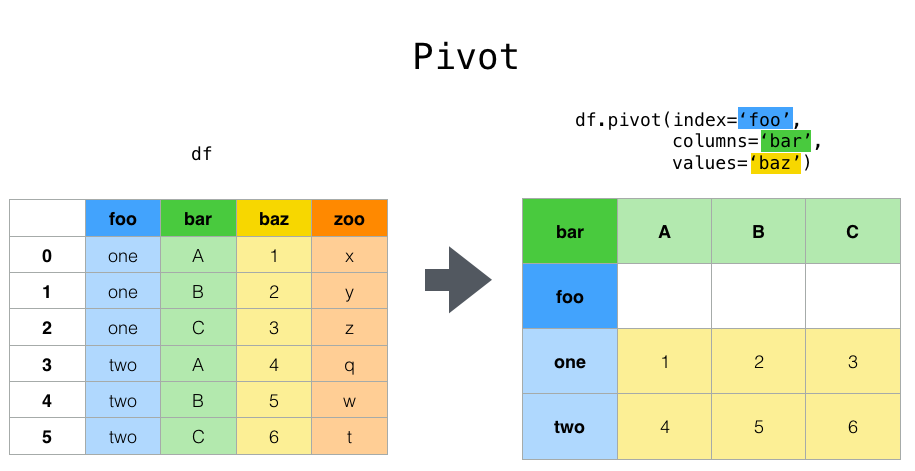
The pivot method reshapes data based on column values and reassignment of the index. Keep in mind, it doesn't always make sense to pivot data. In our machine learning lessons, we will see that our data doesn't need to be pivoted. Pivot methods are mainly for data analysis,visualization, and exploration.
Here is an image showing the idea behind a pivot() call:
help(pd.pivot)Help on function pivot in module pandas.core.reshape.pivot:
pivot(data:'DataFrame', index=None, columns=None, values=None) -> 'DataFrame'
Return reshaped DataFrame organized by given index / column values.
Note: Common Point of Confusion: Students often just randomly pass in index,column, and value choices in an attempt to see the changes. This often just leads to formatting errors. You should first go through this checklist BEFORE running a pivot():
- What question are you trying to answer?
- What would a dataframe that answers the question look like? Does it need a pivot()
- What you want the resulting pivot to look like? Do you need all the original columns?
dfAccount Number
Company
Contact
Account Manager
Product** What type of question does a pivot help answer?**
Imagine we wanted to know, how many licenses of each product type did Google purchase? Currently the way the data is formatted is hard to read. Let's pivot it so this is clearer, we will take a subset of the data for the question at hand.
# Let's take a subset, otherwise we'll get an error due to duplicate rows and data
licenses = df[['Company','Product','Licenses']]
licensesCompany
Product
Licenses
0
Googlepd.pivot(data=licenses,index='Company',columns='Product',values='Licenses')Product
Analytics
GPS Positioning
Prediction
TrackingThe pivot_table() method
Similar to the pivot() method, the pivot_table() can add aggregation functions to a pivot call.
dfAccount Number
Company
Contact
Account Manager
Product# Notice Account Number sum() doesn't make sense to keep/use
pd.pivot_table(df,index="Company",aggfunc='sum')Account Number
Licenses
Sale Price
Company
Google# Either grab the columns
pd.pivot_table(df,index="Company",aggfunc='sum')[['Licenses','Sale Price']]Licenses
Sale Price
Company
Google
600# Or state them as wanted values
pd.pivot_table(df,index="Company",aggfunc='sum',values=['Licenses','Sale Price'])Licenses
Sale Price
Company
Google
600df.groupby('Company').sum()[['Licenses','Sale Price']]Licenses
Sale Price
Company
Google
600pd.pivot_table(df,index=["Account Manager","Contact"],values=['Sale Price'],aggfunc='sum')Sale Price
Account Manager
Contact
Claude Shannon
Cindy PhonerColumns are optional - they provide an additional way to segment the actual values you care about. The aggregation functions are applied to the values you list.
pd.pivot_table(df,index=["Account Manager","Contact"],values=["Sale Price"],columns=["Product"],aggfunc=[np.sum])sum
Sale Price
Product
Analytics
GPS Positioningpd.pivot_table(df,index=["Account Manager","Contact"],values=["Sale Price"],columns=["Product"],aggfunc=[np.sum],fill_value=0)sum
Sale Price
Product
Analytics
GPS Positioning# Can add multiple agg functions
pd.pivot_table(df,index=["Account Manager","Contact"],values=["Sale Price"],columns=["Product"],
aggfunc=[np.sum,np.mean],fill_value=0)sum
mean
Sale Price
Sale Price
Product# Can add on multiple columns
pd.pivot_table(df,index=["Account Manager","Contact"],values=["Sale Price","Licenses"],columns=["Product"],
aggfunc=[np.sum],fill_value=0)sum
Licenses
Sale Price
Product
Analytics# Can add on multiple columns
pd.pivot_table(df,index=["Account Manager","Contact","Product"],values=["Sale Price","Licenses"],
aggfunc=[np.sum],fill_value=0)sum
Licenses
Sale Price
Account Manager
Contact# get Final "ALL" with margins = True
# Can add on multiple columns
pd.pivot_table(df,index=["Account Manager","Contact","Product"],values=["Sale Price","Licenses"],
aggfunc=[np.sum],fill_value=0,margins=True)sum
Licenses
Sale Price
Account Manager
Contactpd.pivot_table(df,index=["Account Manager","Status"],values=["Sale Price"],
aggfunc=[np.sum],fill_value=0,margins=True)sum
Sale Price
Account Manager
Status
Claude Shannon