++++
++++Data Science
May 2026×Notebook lesson
Notebook converted from Jupyter for blog publishing.
01-Kmeans-Color-Quantization
Driptanil DattaSoftware Developer
K Means Color Quantization
Imports
import numpy as np

import matplotlib.image as mpimg
import matplotlib.pyplot as plt
The Image
image_as_array = mpimg.imread('../DATA/palm_trees.jpg')image_as_array # RGB CODES FOR EACH PIXELRESULT
MORE
array([[[ 25,  89, 127],
        [ 25,  89, 127],
        [ 25,  89, 127],
        ...,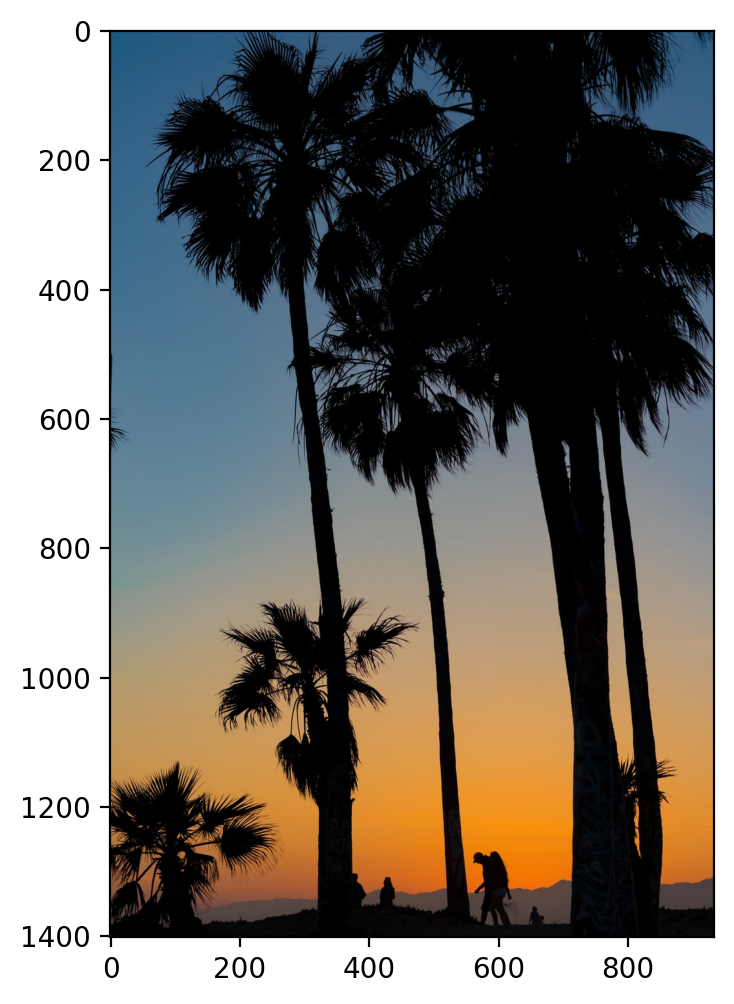
[ 23, 63, 98],plt.figure(figsize=(6,6),dpi=200)
plt.imshow(image_as_array)RESULT
<matplotlib.image.AxesImage at 0x16d48ff0eb0>PLOT
Using Kmeans to Quantize Colors
Quantizing colors means we'll reduce the number of unique colors here to K unique colors. Let's try just 6 colors!
image_as_array.shape
# (h,w,3 color channels)
RESULT
(1401, 934, 3)Convert from 3d to 2d
Kmeans is designed to train on 2D data (data rows and feature columns), so we can reshape the above strip by using (h,w,c) ---> (h * w,c)
(h,w,c) = image_as_array.shapeimage_as_array2d = image_as_array.reshape(h*w,c)from sklearn.cluster import KMeansmodel = KMeans(n_clusters=6)modelRESULT
KMeans(n_clusters=6)labels = model.fit_predict(image_as_array2d)labelsRESULT
array([3, 3, 3, ..., 0, 0, 0])# THESE ARE THE 6 RGB COLOR CODES!
model.cluster_centers_RESULT
MORE
array([[  2.78511649,   2.58768262,   3.70018933],
       [138.48117295, 144.26702702, 143.36832053],
       [193.42381114, 154.48097123, 107.32286981],
       [ 71.66897867, 109.55660624, 137.71325107],
       [219.38959087, 134.67545907,  45.42786667],
rgb_codes = model.cluster_centers_.round(0).astype(int)rgb_codesRESULT
MORE
array([[  3,   3,   4],
       [138, 144, 143],
       [193, 154, 107],
       [ 72, 110, 138],
       [219, 135,  45],
quantized_image = np.reshape(rgb_codes[labels], (h, w, c))quantized_imageRESULT
MORE
array([[[ 72, 110, 138],
        [ 72, 110, 138],
        [ 72, 110, 138],
        ...,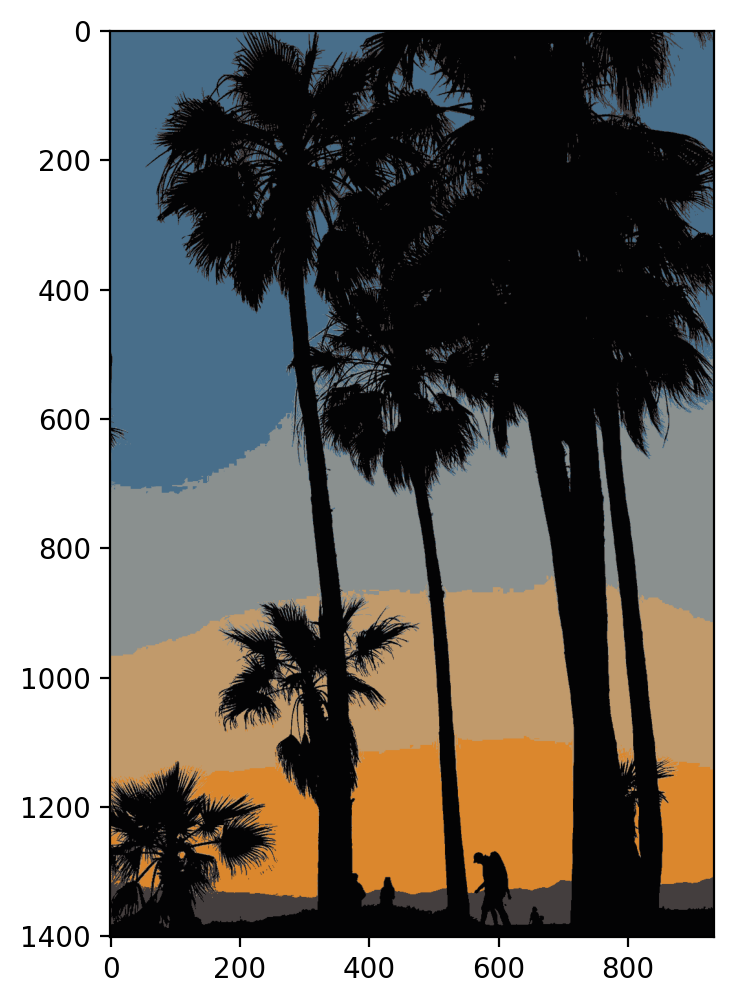
[ 68, 62, 62],plt.figure(figsize=(6,6),dpi=200)
plt.imshow(quantized_image)RESULT
<matplotlib.image.AxesImage at 0x16d5bd928b0>PLOT