++++
++++Notebook converted from Jupyter for blog publishing.
01-DBSCAN-Hyperparameters
DBSCAN Hyperparameters
Let's explore the hyperparameters for DBSCAN and how they can change results!
DBSCAN and Clustering Examples
import numpy as np
import pandas as pd
import matplotlib.pyplot as plt
import seaborn as sns
two_blobs = pd.read_csv('../DATA/cluster_two_blobs.csv')
two_blobs_outliers = pd.read_csv('../DATA/cluster_two_blobs_outliers.csv')sns.scatterplot(data=two_blobs,x='X1',y='X2')<AxesSubplot:xlabel='X1', ylabel='X2'>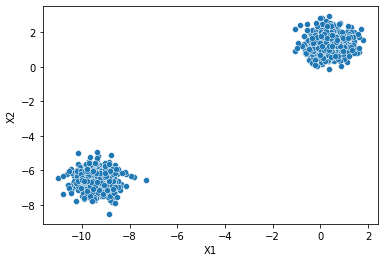
# plt.figure(figsize=(10,6),dpi=200)
sns.scatterplot(data=two_blobs_outliers,x='X1',y='X2')<AxesSubplot:xlabel='X1', ylabel='X2'>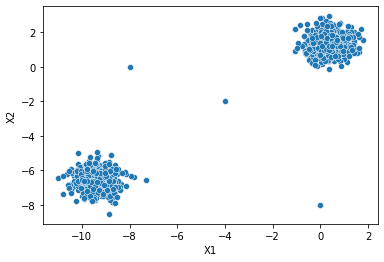
Label Discovery
def display_categories(model,data):
    labels = model.fit_predict(data)
    sns.scatterplot(data=data,x='X1',y='X2',hue=labels,palette='Set1')
DBSCAN
from sklearn.cluster import DBSCANhelp(DBSCAN)Help on class DBSCAN in module sklearn.cluster._dbscan:
class DBSCAN(sklearn.base.ClusterMixin, sklearn.base.BaseEstimator)
| DBSCAN(eps=0.5, *, min_samples=5, metric='euclidean', metric_params=None, algorithm='auto', leaf_size=30, p=None, n_jobs=None)
| dbscan = DBSCAN()display_categories(dbscan,two_blobs)
display_categories(dbscan,two_blobs_outliers)
Epsilon
eps : float, default=0.5 | The maximum distance between two samples for one to be considered | as in the neighborhood of the other. This is not a maximum bound | on the distances of points within a cluster. This is the most | important DBSCAN parameter to choose appropriately for your data set | and distance function.
# Tiny Epsilon --> Tiny Max Distance --> Everything is an outlier (class=-1)
dbscan = DBSCAN(eps=0.001)
display_categories(dbscan,two_blobs_outliers)
# Huge Epsilon --> Huge Max Distance --> Everything is in the same cluster (class=0)
dbscan = DBSCAN(eps=10)
display_categories(dbscan,two_blobs_outliers)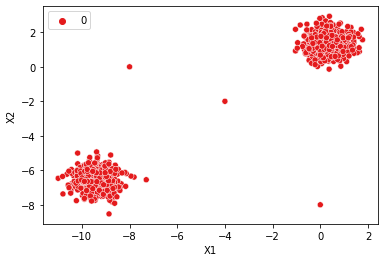
# How to find a good epsilon?
plt.figure(figsize=(10,6),dpi=200)
dbscan = DBSCAN(eps=1)
display_categories(dbscan,two_blobs_outliers)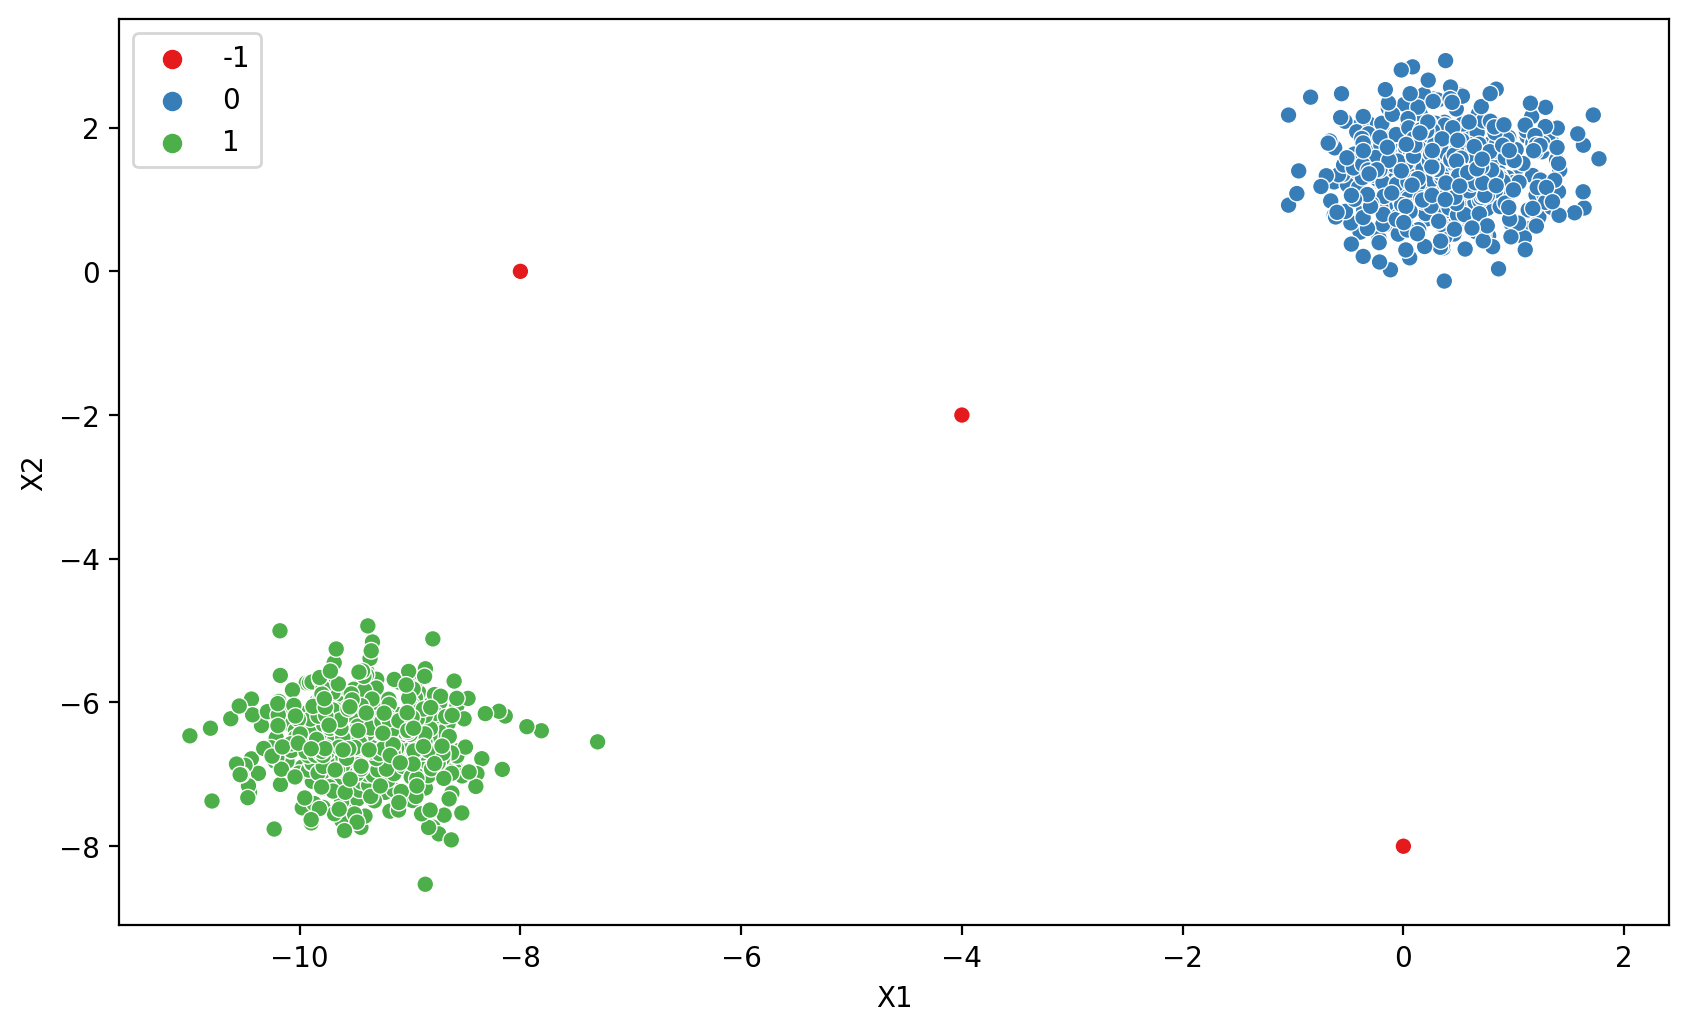
dbscan.labels_array([ 0, 1, 0, ..., -1, -1, -1], dtype=int64)dbscan.labels_ == -1array([False, False, False, ..., True, True, True])np.sum(dbscan.labels_ == -1)3100 * np.sum(dbscan.labels_ == -1) / len(dbscan.labels_)0.29910269192422734Charting reasonable Epsilon values
# bend the knee! https://raghavan.usc.edu/papers/kneedle-simplex11.pdf# np.arange(start=0.01,stop=10,step=0.01)outlier_percent = []
number_of_outliers = []
for eps in np.linspace(0.001,10,100):
# Create Model
dbscan = DBSCAN(eps=eps)
dbscan.fit(two_blobs_outliers)
# Log Number of Outliers
number_of_outliers.append(np.sum(dbscan.labels_ == -1))
# Log percentage of points that are outliers
perc_outliers = 100 * np.sum(dbscan.labels_ == -1) / len(dbscan.labels_)
outlier_percent.append(perc_outliers)sns.lineplot(x=np.linspace(0.001,10,100),y=outlier_percent)
plt.ylabel("Percentage of Points Classified as Outliers")
plt.xlabel("Epsilon Value")Text(0.5, 0, 'Epsilon Value')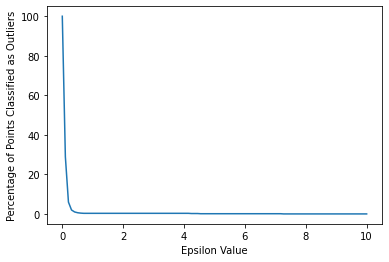
sns.lineplot(x=np.linspace(0.001,10,100),y=number_of_outliers)
plt.ylabel("Number of Points Classified as Outliers")
plt.xlabel("Epsilon Value")
plt.xlim(0,1)(0.0, 1.0)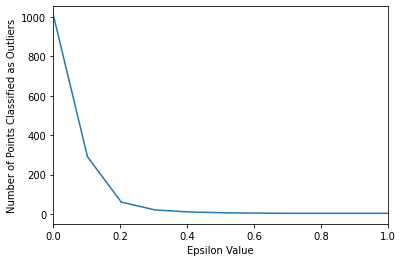
Do we want to think in terms of percentage targeting instead?
If so, you could "target" a percentage, like choose a range producing 1%-5% as outliers.
sns.lineplot(x=np.linspace(0.001,10,100),y=outlier_percent)
plt.ylabel("Percentage of Points Classified as Outliers")
plt.xlabel("Epsilon Value")
plt.ylim(0,5)
plt.xlim(0,2)
plt.hlines(y=1,xmin=0,xmax=2,colors='red',ls='--')<matplotlib.collections.LineCollection at 0x19a401a0af0>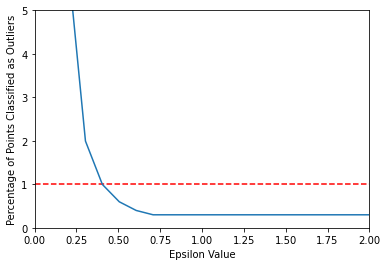
# How to find a good epsilon?
dbscan = DBSCAN(eps=0.4)
display_categories(dbscan,two_blobs_outliers)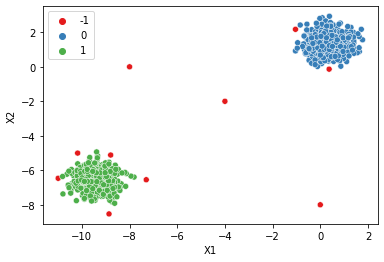
Do we want to think in terms of number of outliers targeting instead?
If so, you could "target" a number of outliers, such as 3 points as outliers.
sns.lineplot(x=np.linspace(0.001,10,100),y=number_of_outliers)
plt.ylabel("Number of Points Classified as Outliers")
plt.xlabel("Epsilon Value")
plt.ylim(0,10)
plt.xlim(0,6)
plt.hlines(y=3,xmin=0,xmax=10,colors='red',ls='--')<matplotlib.collections.LineCollection at 0x19a40070670>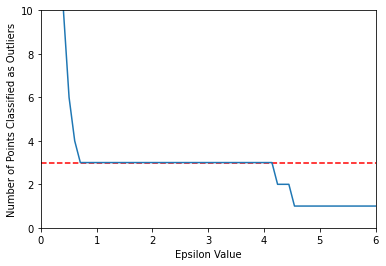
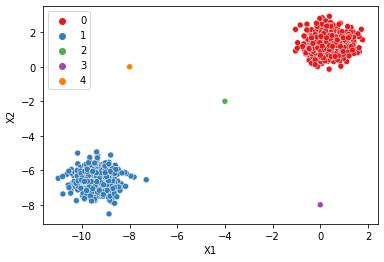
# How to find a good epsilon?
dbscan = DBSCAN(eps=0.75)
display_categories(dbscan,two_blobs_outliers)
Minimum Samples
| min_samples : int, default=5 | The number of samples (or total weight) in a neighborhood for a point | to be considered as a core point. This includes the point itself.
How to choose minimum number of points?
outlier_percent = []

for n in np.arange(1,100):

    # Create Model
    dbscan = DBSCAN(min_samples=n)
    dbscan.fit(two_blobs_outliers)

    # Log percentage of points that are outliers
    perc_outliers = 100 * np.sum(dbscan.labels_ == -1) / len(dbscan.labels_)

outlier_percent.append(perc_outliers)sns.lineplot(x=np.arange(1,100),y=outlier_percent)
plt.ylabel("Percentage of Points Classified as Outliers")
plt.xlabel("Minimum Number of Samples")Text(0.5, 0, 'Minimum Number of Samples')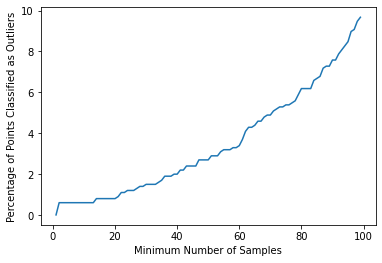
num_dim = two_blobs_outliers.shape[1]

dbscan = DBSCAN(min_samples=2*num_dim)
display_categories(dbscan,two_blobs_outliers)
num_dim = two_blobs_outliers.shape[1]

dbscan = DBSCAN(eps=0.75,min_samples=2*num_dim)
display_categories(dbscan,two_blobs_outliers)
dbscan = DBSCAN(min_samples=1)
display_categories(dbscan,two_blobs_outliers)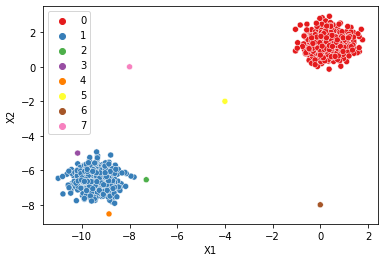
dbscan = DBSCAN(eps=0.75,min_samples=1)
display_categories(dbscan,two_blobs_outliers)