++++
++++Notebook converted from Jupyter for blog publishing.
00-Decision-Trees
Decision Trees
The Data
We will be using the same dataset through our discussions on classification with tree-methods (Decision Tree,Random Forests, and Gradient Boosted Trees) in order to compare performance metrics across these related models.
We will work with the "Palmer Penguins" dataset, as it is simple enough to help us fully understand how changing hyperparameters can change classification results.
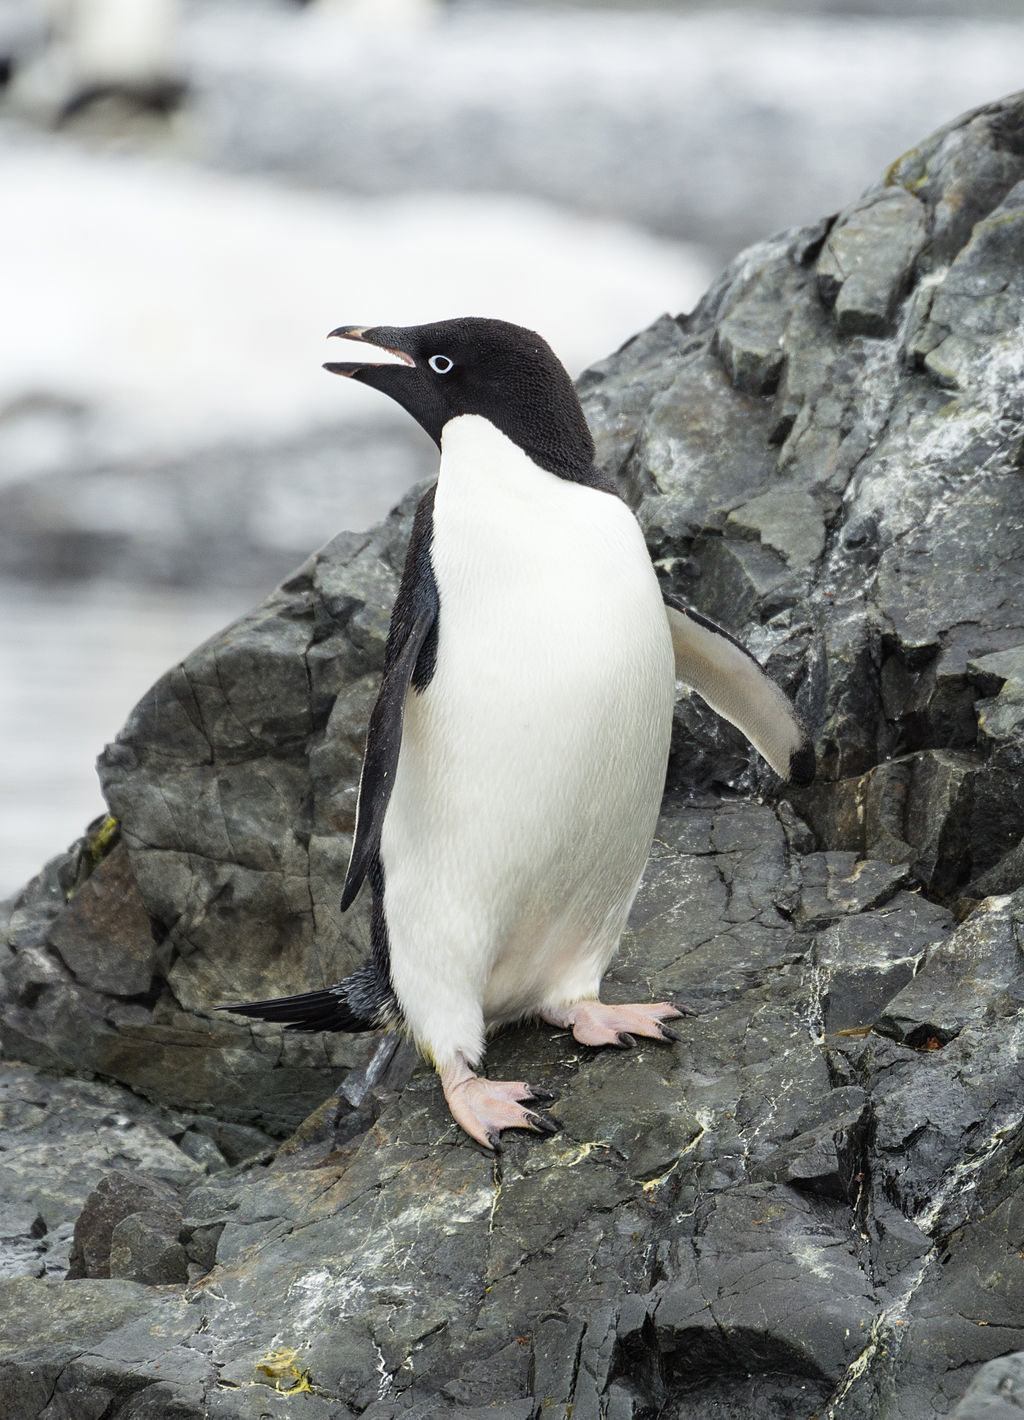
Data were collected and made available by Dr. Kristen Gorman and the Palmer Station, Antarctica LTER, a member of the Long Term Ecological Research Network.
Gorman KB, Williams TD, Fraser WR (2014) Ecological Sexual Dimorphism and Environmental Variability within a Community of Antarctic Penguins (Genus Pygoscelis). PLoS ONE 9(3): e90081. doi:10.1371/journal.pone.0090081
Summary: The data folder contains two CSV files. For intro courses/examples, you probably want to use the first one (penguins_size.csv).
-
penguins_size.csv: Simplified data from original penguin data sets. Contains variables:
- species: penguin species (Chinstrap, Adélie, or Gentoo)
- culmen_length_mm: culmen length (mm)
- culmen_depth_mm: culmen depth (mm)
- flipper_length_mm: flipper length (mm)
- body_mass_g: body mass (g)
- island: island name (Dream, Torgersen, or Biscoe) in the Palmer Archipelago (Antarctica)
- sex: penguin sex
-
(Not used) penguins_lter.csv: Original combined data for 3 penguin species
Note: The culmen is "the upper ridge of a bird's beak"
Our goal is to create a model that can help predict a species of a penguin based on physical attributes, then we can use that model to help researchers classify penguins in the field, instead of needing an experienced biologist
Imports
import numpy as np
import pandas as pd
import matplotlib.pyplot as plt
import seaborn as sns
df = pd.read_csv("../DATA/penguins_size.csv")df.head()species
island
culmen_length_mm
culmen_depth_mm
flipper_length_mmEDA
Missing Data
Recall the purpose is to create a model for future use, so data points missing crucial information won't help in this task, especially since for future data points we will assume the research will grab the relevant feature information.
df.info()<class 'pandas.core.frame.DataFrame'>
RangeIndex: 344 entries, 0 to 343
Data columns (total 7 columns):
# Column Non-Null Count Dtype
--- ------ -------------- ----- df.isna().sum()species 0
island 0
culmen_length_mm 2
culmen_depth_mm 2
flipper_length_mm 2# What percentage are we dropping?
100*(10/344)2.9069767441860463df = df.dropna()df.info()<class 'pandas.core.frame.DataFrame'>
Int64Index: 334 entries, 0 to 343
Data columns (total 7 columns):
# Column Non-Null Count Dtype
--- ------ -------------- ----- df.head()species
island
culmen_length_mm
culmen_depth_mm
flipper_length_mmdf['sex'].unique()array(['MALE', 'FEMALE', '.'], dtype=object)df['island'].unique()array(['Torgersen', 'Biscoe', 'Dream'], dtype=object)df = df[df['sex']!='.']Visualization
sns.scatterplot(x='culmen_length_mm',y='culmen_depth_mm',data=df,hue='species',palette='Dark2')<AxesSubplot:xlabel='culmen_length_mm', ylabel='culmen_depth_mm'>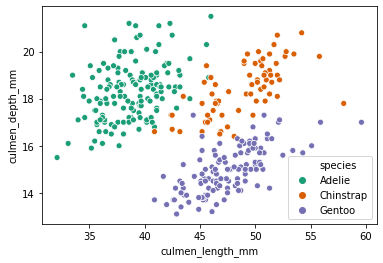
sns.pairplot(df,hue='species',palette='Dark2')<seaborn.axisgrid.PairGrid at 0x24fa25bc9c8>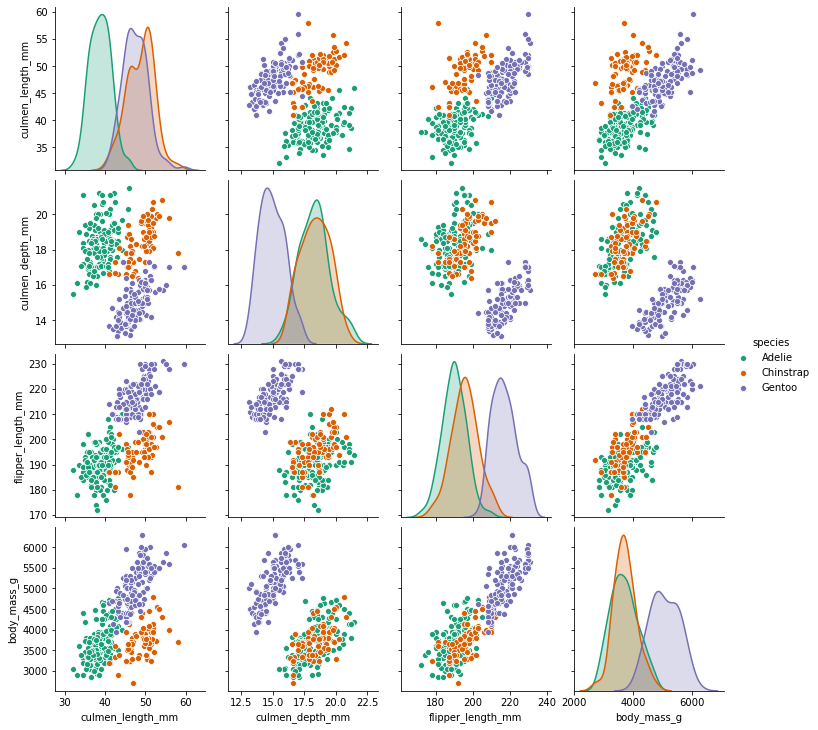
sns.catplot(x='species',y='culmen_length_mm',data=df,kind='box',col='sex',palette='Dark2')<seaborn.axisgrid.FacetGrid at 0x24fa3019ec8>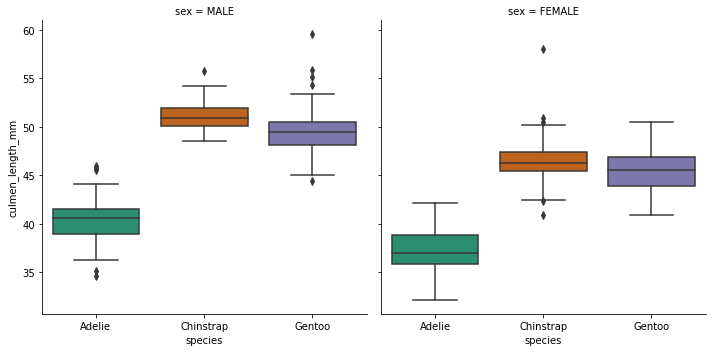
Feature Engineering
pd.get_dummies(df)culmen_length_mm
culmen_depth_mm
flipper_length_mm
body_mass_g
species_Adeliepd.get_dummies(df.drop('species',axis=1),drop_first=True)culmen_length_mm
culmen_depth_mm
flipper_length_mm
body_mass_g
island_DreamTrain | Test Split
X = pd.get_dummies(df.drop('species',axis=1),drop_first=True)
y = df['species']
from sklearn.model_selection import train_test_splitX_train, X_test, y_train, y_test = train_test_split(X, y, test_size=0.3, random_state=101)Decision Tree Classifier
Default Hyperparameters
from sklearn.tree import DecisionTreeClassifiermodel = DecisionTreeClassifier()model.fit(X_train,y_train)DecisionTreeClassifier()base_pred = model.predict(X_test)Evaluation
from sklearn.metrics import confusion_matrix,classification_report,plot_confusion_matrixconfusion_matrix(y_test,base_pred)array([[38, 2, 0],
[ 1, 26, 0],
[ 1, 0, 32]], dtype=int64)plot_confusion_matrix(model,X_test,y_test)<sklearn.metrics._plot.confusion_matrix.ConfusionMatrixDisplay at 0x24fa55e2888>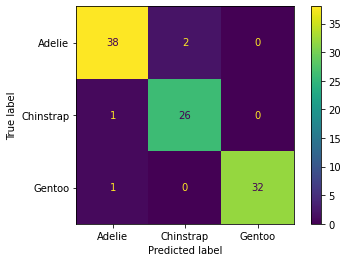
print(classification_report(y_test,base_pred)) precision recall f1-score support
Adelie 0.95 0.95 0.95 40
Chinstrap 0.93 0.96 0.95 27
Gentoo 1.00 0.97 0.98 33model.feature_importances_array([0.33350103, 0.02010577, 0.57575804, 0. , 0.04491847,
0. , 0.02571668])pd.DataFrame(index=X.columns,data=model.feature_importances_,columns=['Feature Importance'])Feature Importance
culmen_length_mm
0.333501
culmen_depth_mm
0.020106sns.boxplot(x='species',y='body_mass_g',data=df)<AxesSubplot:xlabel='species', ylabel='body_mass_g'>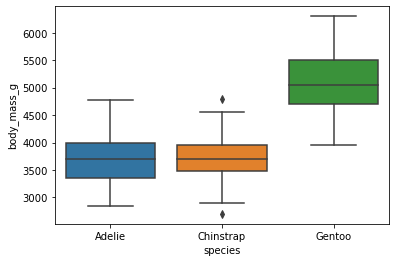
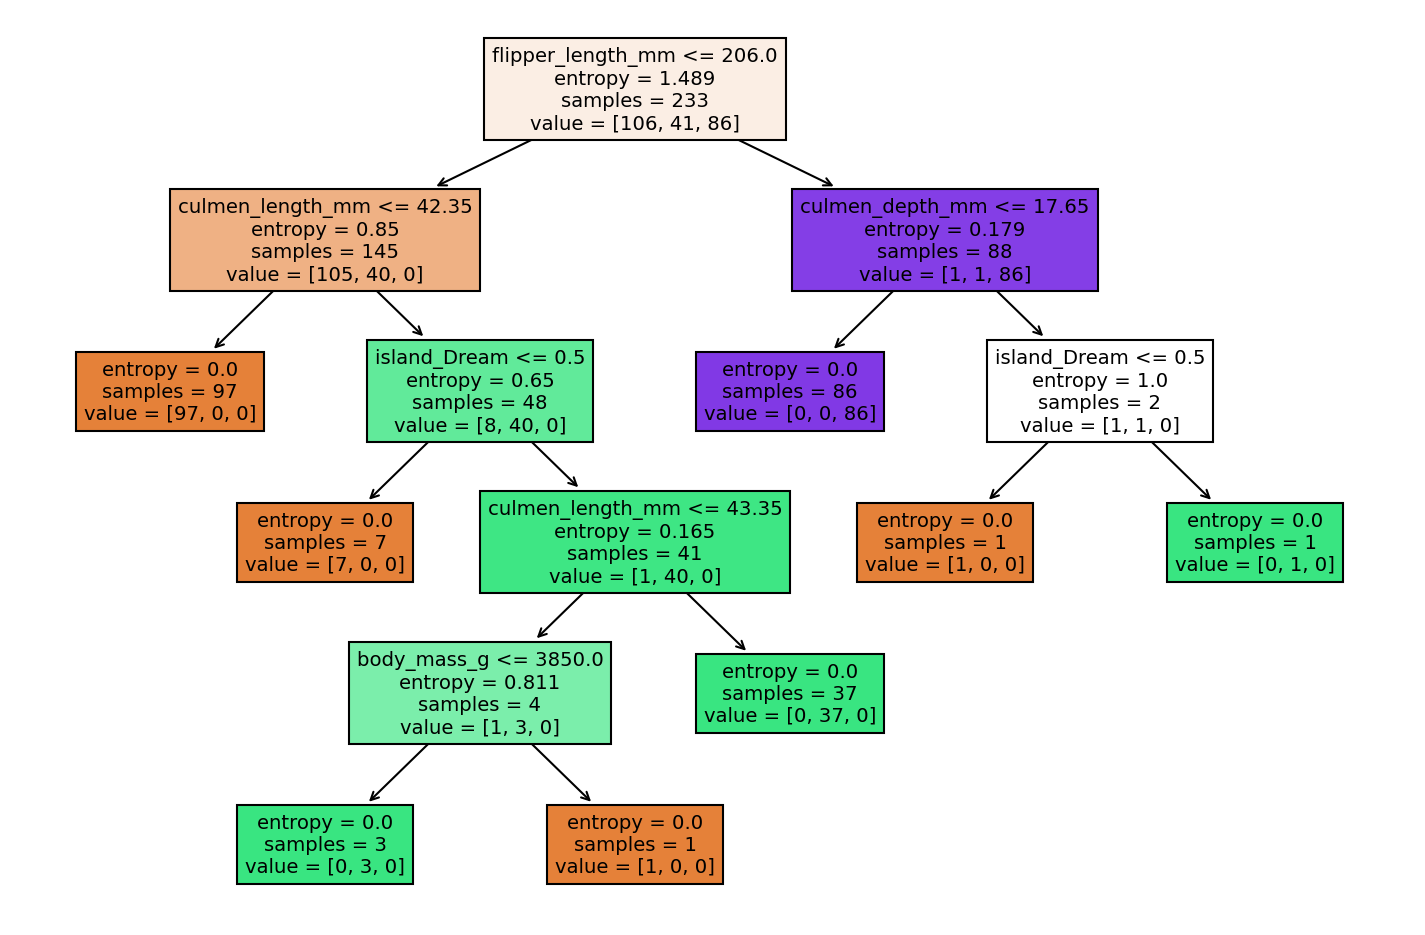
Visualize the Tree
This function is fairly new, you may want to review the online docs:
Online Documentation: https://scikit-learn.org/stable/modules/generated/sklearn.tree.plot_tree.html (opens in a new tab)
from sklearn.tree import plot_treeplt.figure(figsize=(12,8))
plot_tree(model);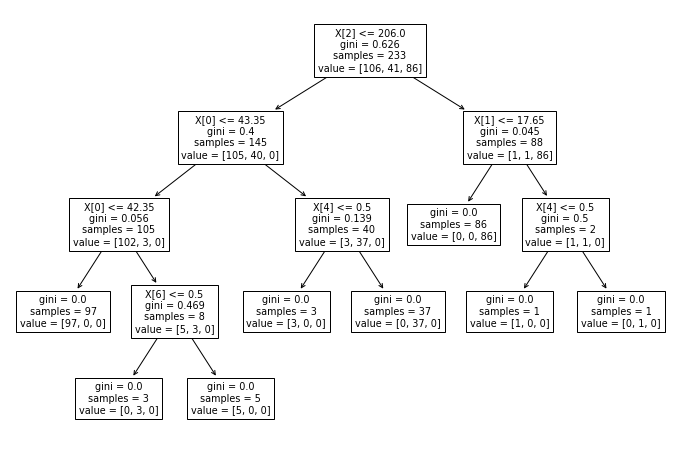
plt.figure(figsize=(12,8),dpi=150)
plot_tree(model,filled=True,feature_names=X.columns);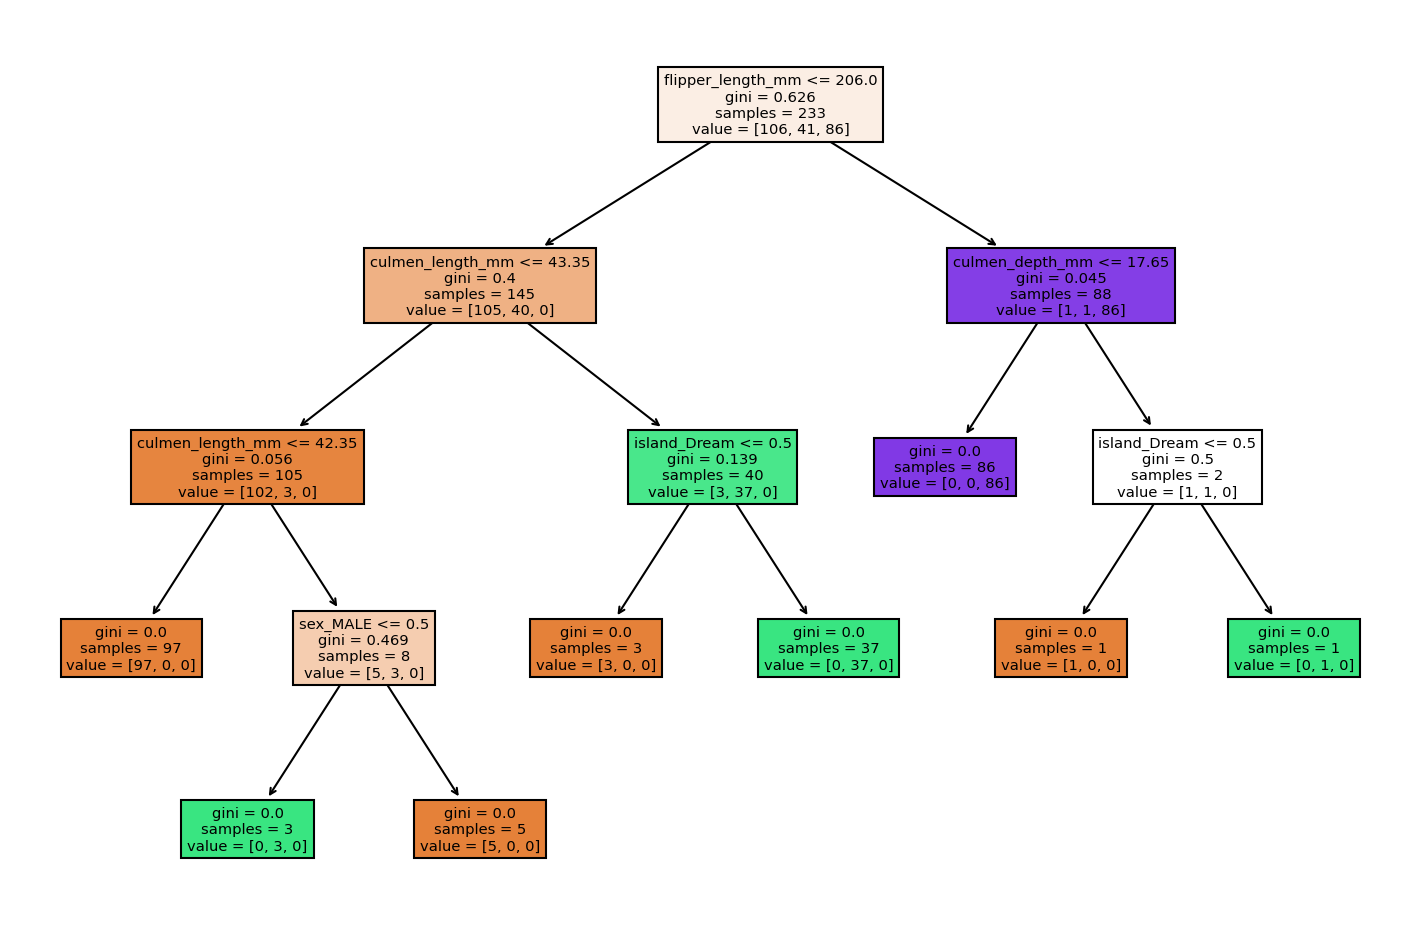
Reporting Model Results
To begin experimenting with hyperparameters, let's create a function that reports back classification results and plots out the tree.
def report_model(model):
    model_preds = model.predict(X_test)
    print(classification_report(y_test,model_preds))
    print('\n')
    plt.figure(figsize=(12,8),dpi=150)
    plot_tree(model,filled=True,feature_names=X.columns);
Understanding Hyperparameters
Max Depth
help(DecisionTreeClassifier)Help on class DecisionTreeClassifier in module sklearn.tree._classes:
class DecisionTreeClassifier(sklearn.base.ClassifierMixin, BaseDecisionTree)
| DecisionTreeClassifier(*, criterion='gini', splitter='best', max_depth=None, min_samples_split=2, min_samples_leaf=1, min_weight_fraction_leaf=0.0, max_features=None, random_state=None, max_leaf_nodes=None, min_impurity_decrease=0.0, min_impurity_split=None, class_weight=None, presort='deprecated', ccp_alpha=0.0)
| pruned_tree = DecisionTreeClassifier(max_depth=2)
pruned_tree.fit(X_train,y_train)DecisionTreeClassifier(max_depth=2)report_model(pruned_tree) precision recall f1-score support
Adelie 0.87 0.97 0.92 40
Chinstrap 0.91 0.78 0.84 27
Gentoo 1.00 0.97 0.98 33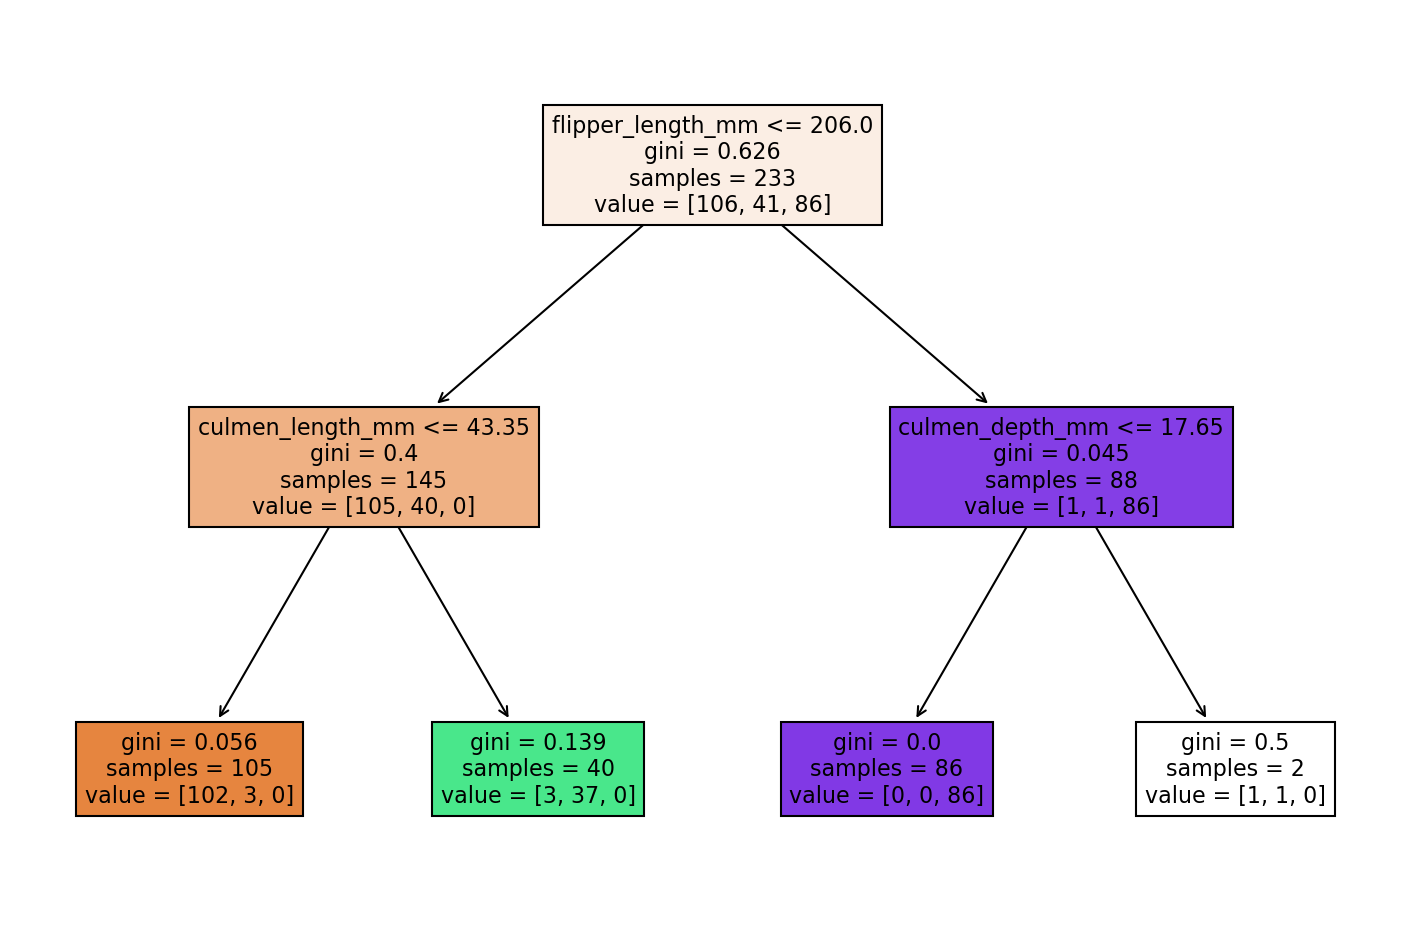
Max Leaf Nodes
pruned_tree = DecisionTreeClassifier(max_leaf_nodes=3)
pruned_tree.fit(X_train,y_train)DecisionTreeClassifier(max_leaf_nodes=3)report_model(pruned_tree) precision recall f1-score support
Adelie 0.95 0.95 0.95 40
Chinstrap 0.91 0.78 0.84 27
Gentoo 0.86 0.97 0.91 33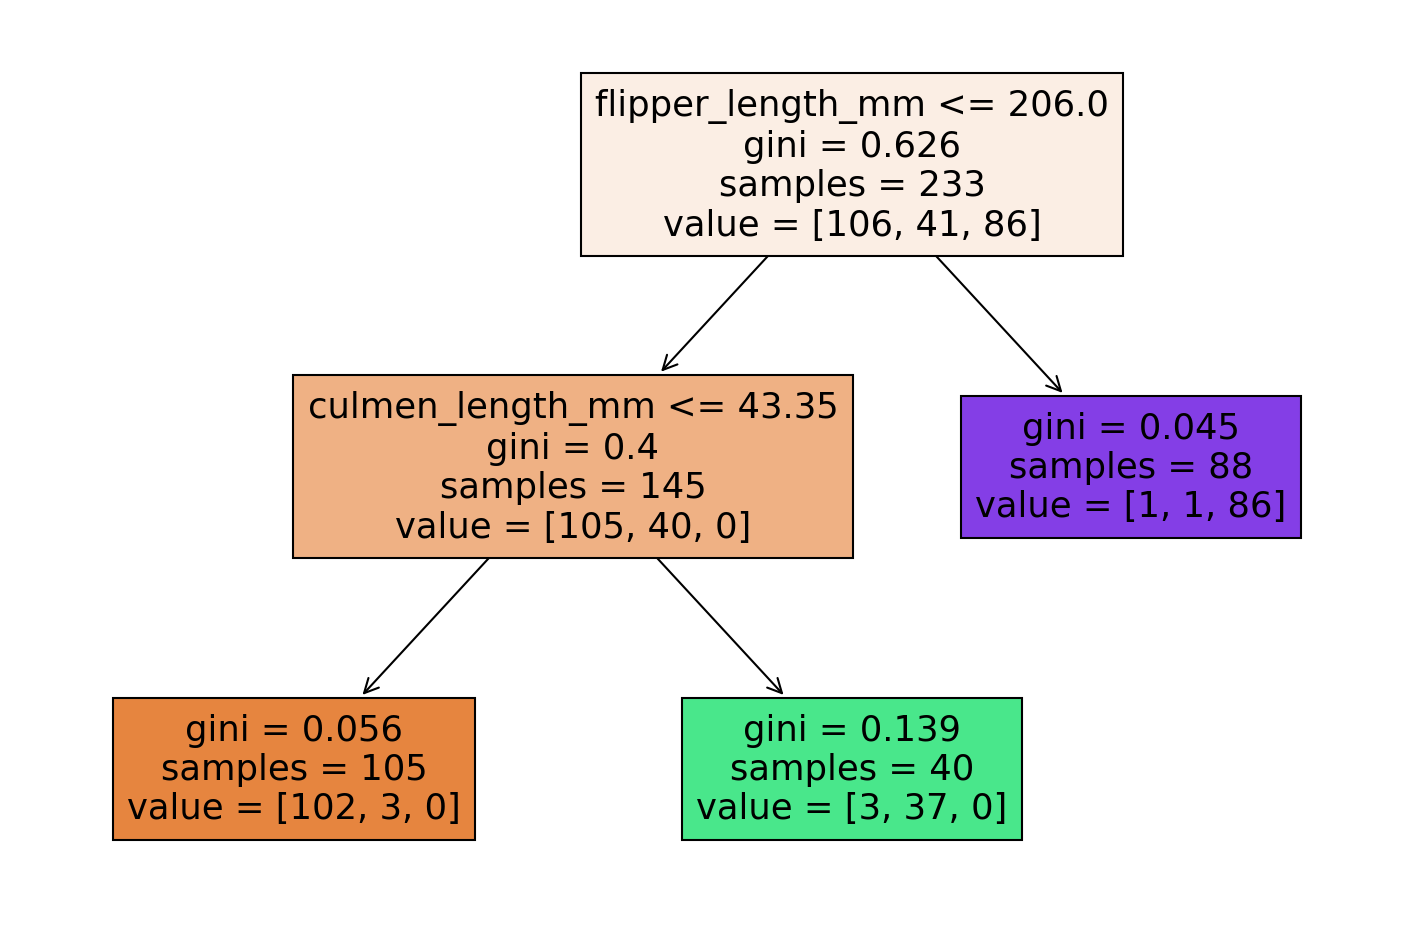
Criterion
entropy_tree = DecisionTreeClassifier(criterion='entropy')
entropy_tree.fit(X_train,y_train)DecisionTreeClassifier(criterion='entropy')report_model(entropy_tree) precision recall f1-score support
Adelie 0.95 0.95 0.95 40
Chinstrap 0.93 0.96 0.95 27
Gentoo 1.00 0.97 0.98 33