 ++++
++++Data Science
May 2026×Notebook lesson
Notebook converted from Jupyter for blog publishing.
KNN-Classification
Driptanil DattaSoftware Developer
import numpy as np
import pandas as pd
import matplotlib.pyplot as plt
import seaborn as sns
df = pd.read_csv('../DATA/gene_expression.csv')df.head()HTML
MORE
Gene One
Gene Two
Cancer Present
0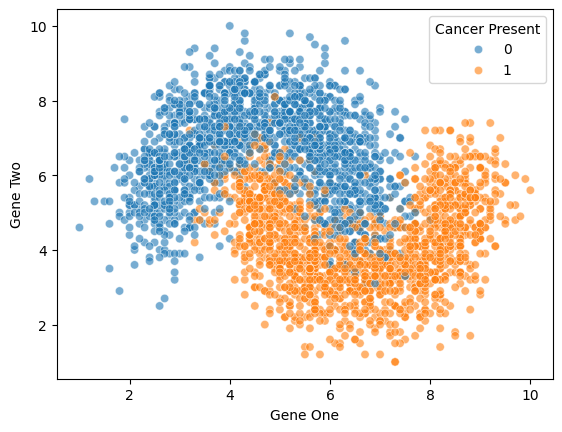
4.3sns.scatterplot(x='Gene One', y='Gene Two', hue='Cancer Present', data=df, alpha=0.6)RESULT
<Axes: xlabel='Gene One', ylabel='Gene Two'>PLOT
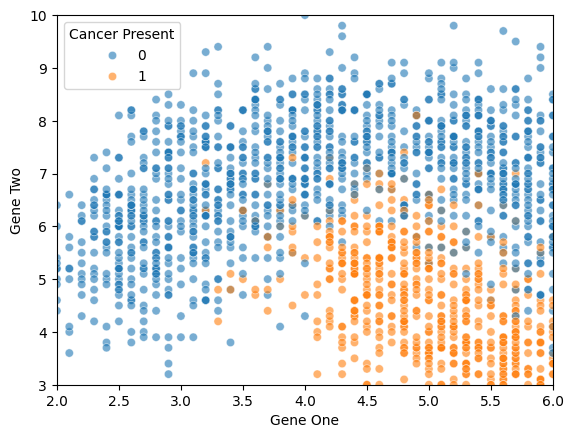
sns.scatterplot(x='Gene One',y='Gene Two',hue='Cancer Present',data=df, alpha=0.6)

plt.xlim(2,6)
plt.ylim(3,10)
RESULT
(3.0, 10.0)PLOT
from sklearn.model_selection import train_test_split
from sklearn.preprocessing import StandardScaler
X = df.drop('Cancer Present',axis=1)
y = df['Cancer Present']X_train, X_test, y_train, y_test = train_test_split(X, y, test_size=0.3, random_state=42)scaler = StandardScaler()