 ++++
++++Notebook converted from Jupyter for blog publishing.
02-SVM-Project-Exercise
Support Vector Machines
Exercise
Fraud in Wine (opens in a new tab)
Wine fraud relates to the commercial aspects of wine. The most prevalent type of fraud is one where wines are adulterated, usually with the addition of cheaper products (e.g. juices) and sometimes with harmful chemicals and sweeteners (compensating for color or flavor).
Counterfeiting and the relabelling of inferior and cheaper wines to more expensive brands is another common type of wine fraud.
Project Goals
A distribution company that was recently a victim of fraud has completed an audit of various samples of wine through the use of chemical analysis on samples. The distribution company specializes in exporting extremely high quality, expensive wines, but was defrauded by a supplier who was attempting to pass off cheap, low quality wine as higher grade wine. The distribution company has hired you to attempt to create a machine learning model that can help detect low quality (a.k.a "fraud") wine samples. They want to know if it is even possible to detect such a difference.
Data Source: P. Cortez, A. Cerdeira, F. Almeida, T. Matos and J. Reis. Modeling wine preferences by data mining from physicochemical properties. In Decision Support Systems, Elsevier, 47(4):547-553, 2009.
TASK: Your overall goal is to use the wine dataset shown below to develop a machine learning model that attempts to predict if a wine is "Legit" or "Fraud" based on various chemical features. Complete the tasks below to follow along with the project.
Complete the Tasks in bold
TASK: Run the cells below to import the libraries and load the dataset.
import numpy as np
import pandas as pd
import seaborn as sns
import matplotlib.pyplot as plt
df = pd.read_csv("../DATA/wine_fraud.csv")df.head()fixed acidity
volatile acidity
citric acid
residual sugar
chloridesTASK: What are the unique variables in the target column we are trying to predict (quality)?
df.columnsIndex(['fixed acidity', 'volatile acidity', 'citric acid', 'residual sugar',
'chlorides', 'free sulfur dioxide', 'total sulfur dioxide', 'density',
'pH', 'sulphates', 'alcohol', 'quality', 'type'],
dtype='object')df.quality.unique()array(['Legit', 'Fraud'], dtype=object)TASK: Create a countplot that displays the count per category of Legit vs Fraud. Is the label/target balanced or unbalanced?
sns.countplot(x='quality',hue='quality',data=df)<Axes: xlabel='quality', ylabel='count'>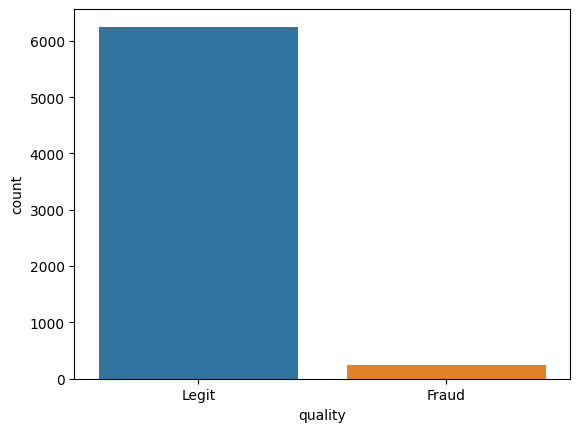
TASK: Let's find out if there is a difference between red and white wine when it comes to fraud. Create a countplot that has the wine type on the x axis with the hue separating columns by Fraud vs Legit.
sns.countplot(x='type',hue='quality',data=df)<Axes: xlabel='type', ylabel='count'>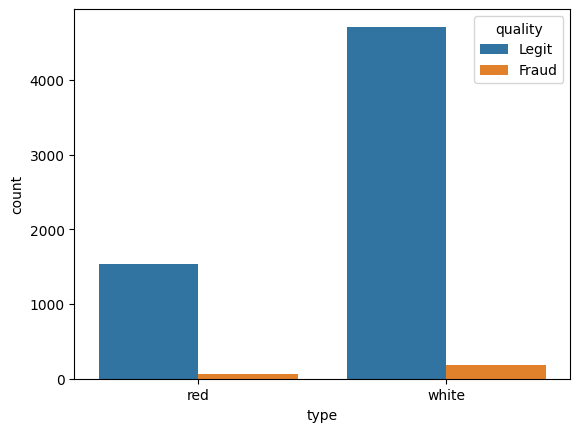
TASK: What percentage of red wines are Fraud? What percentage of white wines are fraud?
reds = df[df['type']=='red']
whites = df[df['type']=='white']len(reds[reds['quality']=='Fraud']) / len(reds) * 1003.9399624765478425len(whites[whites['quality']=='Fraud']) / len(whites) * 1003.7362188648427925TASK: Calculate the correlation between the various features and the "quality" column. To do this you may need to map the column to 0 and 1 instead of a string.
df['Fraud']= df['quality'].map({'Legit':0,'Fraud':1})df.corr(numeric_only=True)['Fraud']fixed acidity 0.021794
volatile acidity 0.151228
citric acid -0.061789
residual sugar -0.048756
chlorides 0.034499TASK: Create a bar plot of the correlation values to Fraudlent wine.
df.corr(numeric_only=True)['Fraud'][:-1].sort_values().plot(kind='bar')<Axes: >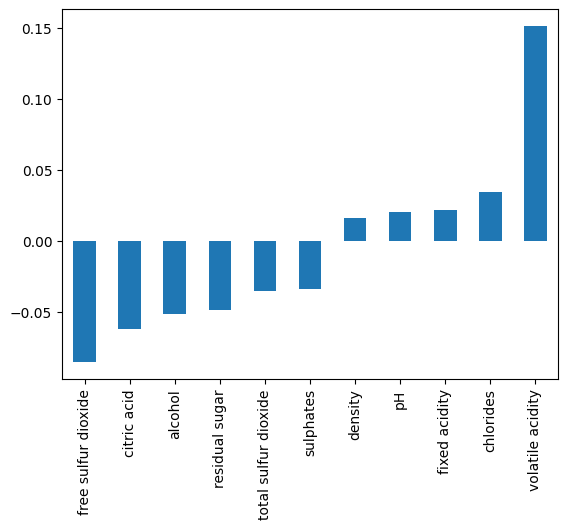
TASK: Create a clustermap with seaborn to explore the relationships between variables.
sns.clustermap(df.corr(numeric_only=True) ,annot=True)<seaborn.matrix.ClusterGrid at 0x126aa3f80>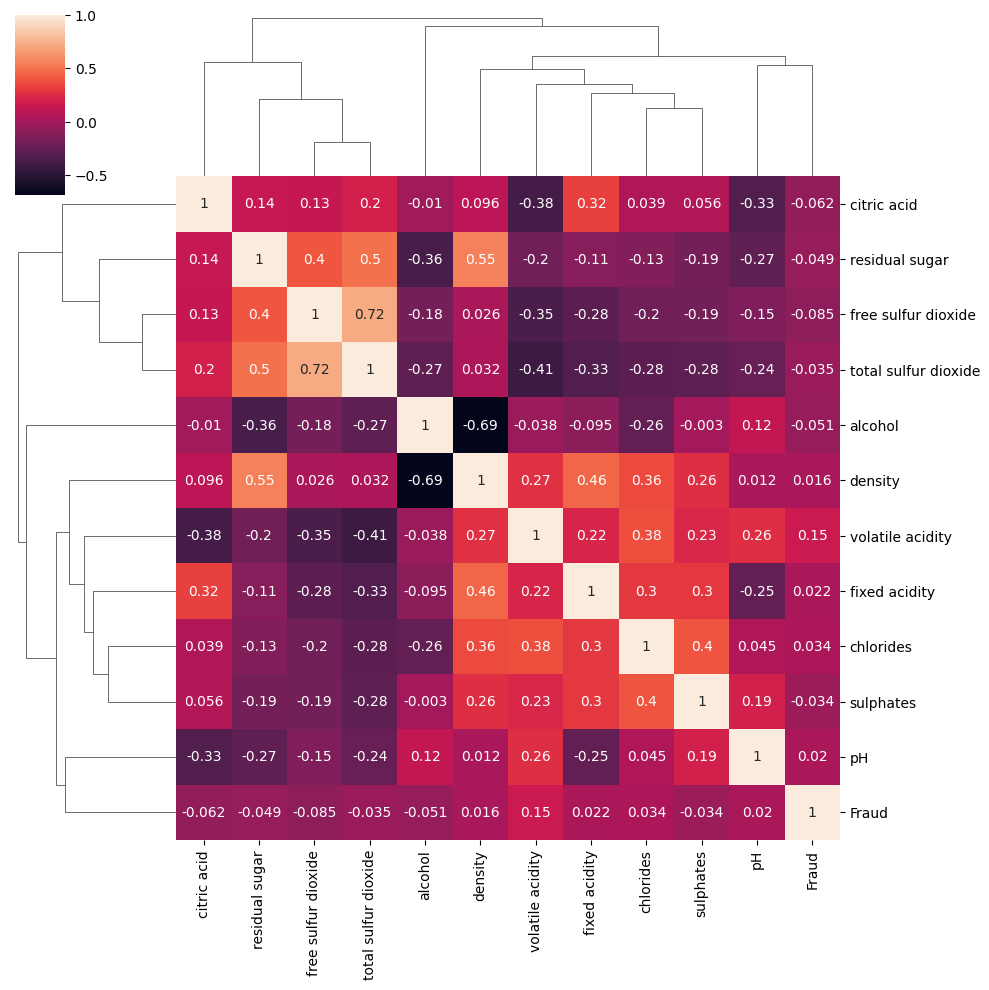
Machine Learning Model
TASK: Convert the categorical column "type" from a string or "red" or "white" to dummy variables:
whites = df[df['type']=='white']
reds = df[df['type']=='red']df['type'] = pd.get_dummies(df['type'],drop_first=True)
df = df.drop('Fraud',axis=1)TASK: Separate out the data into X features and y target label ("quality" column)
X = df.drop('quality',axis=1)
y = df['quality']
TASK: Perform a Train|Test split on the data, with a 10% test size. Note: The solution uses a random state of 101
from sklearn.model_selection import train_test_split


X_train, X_test, y_train, y_test = train_test_split(X,y,test_size=0.1,random_state=101)
TASK: Scale the X train and X test data.
from sklearn.preprocessing import StandardScaler

scaler = StandardScaler()

scaled_X_train = scaler.fit_transform(X_train)
scaled_X_test = scaler.transform(X_test)ValueError: could not convert string to float: 'red'
---------------------------------------------------------------------------
ValueError Traceback (most recent call last)
/var/folders/41/x856_7w17ss36djfjfjccwcr0000gn/T/ipykernel_54804/2359573251.py in ?()
1 from sklearn.preprocessing import StandardScalerTASK: Create an instance of a Support Vector Machine classifier. Previously we have left this model "blank", (e.g. with no parameters). However, we already know that the classes are unbalanced, in an attempt to help alleviate this issue, we can automatically adjust weights inversely proportional to class frequencies in the input data with a argument call in the SVC() call. Check out the documentation for SVC (opens in a new tab) online and look up what the argument\parameter is.
from sklearn.svm import SVC

model = SVC()
TASK: Use a GridSearchCV to run a grid search for the best C and gamma parameters.
from sklearn.model_selection import GridSearchCV


param_grid = {'C':[0.1,1,10,100],'gamma':['scaler', 'auto']}
grid = GridSearchCV(model,param_grid)grid.fit(X_train,y_train)/Users/drippy/.pyenv/versions/3.12.6/lib/python3.12/site-packages/sklearn/model_selection/_validation.py:516: FitFailedWarning:
20 fits failed out of a total of 40.
The score on these train-test partitions for these parameters will be set to nan.
If these failures are not expected, you can try to debug them by setting error_score='raise'.
GridSearchCV(estimator=SVC(),
param_grid={'C': [0.1, 1, 10, 100], 'gamma': ['scaler', 'auto']})In a Jupyter environment, please rerun this cell to show the HTML representation or trust the notebook.
On GitHub, the HTML representation is unable to render, please try loading this page with nbviewer.org.
GridSearchCV
?Documentation for GridSearchCViFittedgrid.best_params_{'C': 0.1, 'gamma': 'auto'}TASK: Display the confusion matrix and classification report for your model.
from sklearn.metrics import confusion_matrix,classification_report

pred = grid.predict(X_test)

print(confusion_matrix(y_test,pred))[[ 0 27]
[ 0 623]]print(classification_report(y_test,pred)) precision recall f1-score support
Fraud 0.00 0.00 0.00 27
Legit 0.96 1.00 0.98 623
/Users/drippy/.pyenv/versions/3.12.6/lib/python3.12/site-packages/sklearn/metrics/_classification.py:1731: UndefinedMetricWarning: Precision is ill-defined and being set to 0.0 in labels with no predicted samples. Use `zero_division` parameter to control this behavior.
  _warn_prf(average, modifier, f"{metric.capitalize()} is", result.shape[0])
/Users/drippy/.pyenv/versions/3.12.6/lib/python3.12/site-packages/sklearn/metrics/_classification.py:1731: UndefinedMetricWarning: Precision is ill-defined and being set to 0.0 in labels with no predicted samples. Use `zero_division` parameter to control this behavior.
from sklearn.metrics import ConfusionMatrixDisplay
ConfusionMatrixDisplay.from_estimator(grid, X_test, y_test)<sklearn.metrics._plot.confusion_matrix.ConfusionMatrixDisplay at 0x12648c6e0>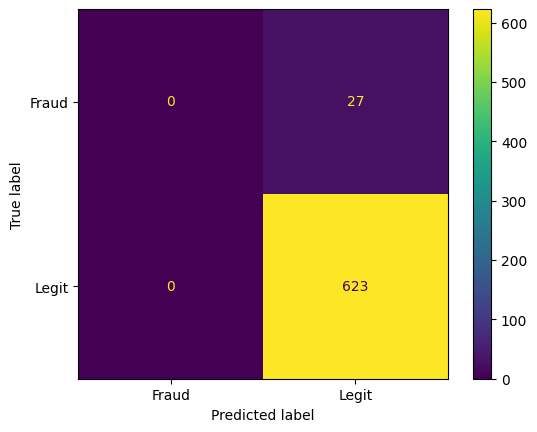
TASK: Finally, think about how well this model performed, would you suggest using it? Realistically will this work?
# ANSWER: View the solutions video for full discussion on this.