Seaborn Exercises - Solutions
Imports
Run the cell below to import the libraries
The Data
DATA SOURCE: https://www.kaggle.com/rikdifos/credit-card-approval-prediction
Data Information:
Credit score cards are a common risk control method in the financial industry. It uses personal information and data submitted by credit card applicants to predict the probability of future defaults and credit card borrowings. The bank is able to decide whether to issue a credit card to the applicant. Credit scores can objectively quantify the magnitude of risk.
Feature Information:
| application_record.csv | ||
|---|---|---|
| Feature name | Explanation | Remarks |
ID | Client number | |
CODE_GENDER | Gender | |
FLAG_OWN_CAR | Is there a car | |
FLAG_OWN_REALTY | Is there a property | |
CNT_CHILDREN | Number of children | |
AMT_INCOME_TOTAL | Annual income | |
NAME_INCOME_TYPE | Income category | |
NAME_EDUCATION_TYPE | Education level | |
NAME_FAMILY_STATUS | Marital status | |
NAME_HOUSING_TYPE | Way of living | |
DAYS_BIRTH | Birthday | Count backwards from current day (0), -1 means yesterday |
DAYS_EMPLOYED | Start date of employment | Count backwards from current day(0). If positive, it means the person currently unemployed. |
FLAG_MOBIL | Is there a mobile phone | |
FLAG_WORK_PHONE | Is there a work phone | |
FLAG_PHONE | Is there a phone | |
FLAG_EMAIL | Is there an email | |
OCCUPATION_TYPE | Occupation | |
CNT_FAM_MEMBERS | Family size |
df = pd.read_csv('application_record.csv')df.head()ID
CODE_GENDER
FLAG_OWN_CAR
FLAG_OWN_REALTY
CNT_CHILDREN108 more lines
AMT_INCOME_TOTAL
NAME_INCOME_TYPE
NAME_EDUCATION_TYPE
NAME_FAMILY_STATUS
NAME_HOUSING_TYPE
DAYS_BIRTH
DAYS_EMPLOYED
FLAG_MOBIL
FLAG_WORK_PHONE
FLAG_PHONE
FLAG_EMAIL
OCCUPATION_TYPE
CNT_FAM_MEMBERS
0
5008804
M
Y
Y
0
427500.0
Working
Higher education
Civil marriage
Rented apartment
-12005
-4542
1
1
0
0
NaN
2.0
1
5008805
M
Y
Y
0
427500.0
Working
Higher education
Civil marriage
Rented apartment
-12005
-4542
1
1
0
0
NaN
2.0
2
5008806
M
Y
Y
0
112500.0
Working
Secondary / secondary special
Married
House / apartment
-21474
-1134
1
0
0
0
Security staff
2.0
3
5008808
F
N
Y
0
270000.0
Commercial associate
Secondary / secondary special
Single / not married
House / apartment
-19110
-3051
1
0
1
1
Sales staff
1.0
4
5008809
F
N
Y
0
270000.0
Commercial associate
Secondary / secondary special
Single / not married
House / apartment
-19110
-3051
1
0
1
1
Sales staff
1.0df.info()<class 'pandas.core.frame.DataFrame'>
RangeIndex: 438557 entries, 0 to 438556
Data columns (total 18 columns):
# Column Non-Null Count Dtype
--- ------ -------------- ----- 20 more lines
 0   ID                   438557 non-null  int64
 1   CODE_GENDER          438557 non-null  object
 2   FLAG_OWN_CAR         438557 non-null  object
 3   FLAG_OWN_REALTY      438557 non-null  object
 4   CNT_CHILDREN         438557 non-null  int64
 5   AMT_INCOME_TOTAL     438557 non-null  float64
 6   NAME_INCOME_TYPE     438557 non-null  object
 7   NAME_EDUCATION_TYPE  438557 non-null  object
 8   NAME_FAMILY_STATUS   438557 non-null  object
 9   NAME_HOUSING_TYPE    438557 non-null  object
 10  DAYS_BIRTH           438557 non-null  int64
 11  DAYS_EMPLOYED        438557 non-null  int64
 12  FLAG_MOBIL           438557 non-null  int64
 13  FLAG_WORK_PHONE      438557 non-null  int64
 14  FLAG_PHONE           438557 non-null  int64
 15  FLAG_EMAIL           438557 non-null  int64
 16  OCCUPATION_TYPE      304354 non-null  object
 17  CNT_FAM_MEMBERS      438557 non-null  float64
dtypes: float64(2), int64(8), object(8)
memory usage: 60.2+ MB
TASKS
Recreate the plots shown in the markdown image cells. Each plot also contains a brief description of what it is trying to convey. Note, these are meant to be quite challenging. Start by first replicating the most basic form of the plot, then attempt to adjust its styling and parameters to match the given image.
In general do not worry about coloring,styling, or sizing matching up exactly. Instead focus on the content of the plot itself. Our goal is not to test you on recognizing figsize=(10,8) , its to test your understanding of being able to see a requested plot, and reproducing it.
NOTE: You may need to perform extra calculations on the pandas dataframe before calling seaborn to create the plot.
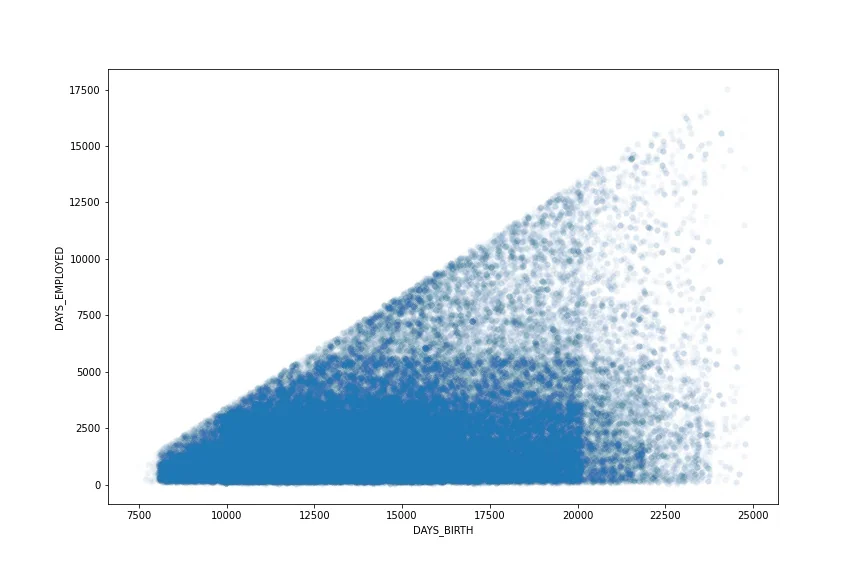
TASK: Recreate the Scatter Plot shown below
*The scatterplot attempts to show the relationship between the days employed versus the age of the person (DAYS_BIRTH) for people who were not unemployed. Note, to reproduce this chart you must remove unemployed people from the dataset first. Also note the sign of the axis, they are both transformed to be positive. Finally, feel free to adjust the alpha and linewidth parameters in the scatterplot since there are so many points stacked on top of each other.*
# CODE HERE TO RECREATE THE PLOT SHOWN ABOVEwarnings.simplefilter('ignore')plt.figure(figsize=(12,8))
# REMOVE UNEMPLOYED PEOPLE
employed = df[df['DAYS_EMPLOYED']<0]
# MAKE BOTH POSITIVE
employed['DAYS_EMPLOYED'] = -1*employed['DAYS_EMPLOYED']
employed['DAYS_BIRTH'] = -1*employed['DAYS_BIRTH']
# With so many points, alpha is tiny, might be an indicated that a
# scatterplot may not be the right choice!
sns.scatterplot(y='DAYS_EMPLOYED',x='DAYS_BIRTH',data=employed,
alpha=0.01,linewidth=0)
plt.savefig('task_one.jpg')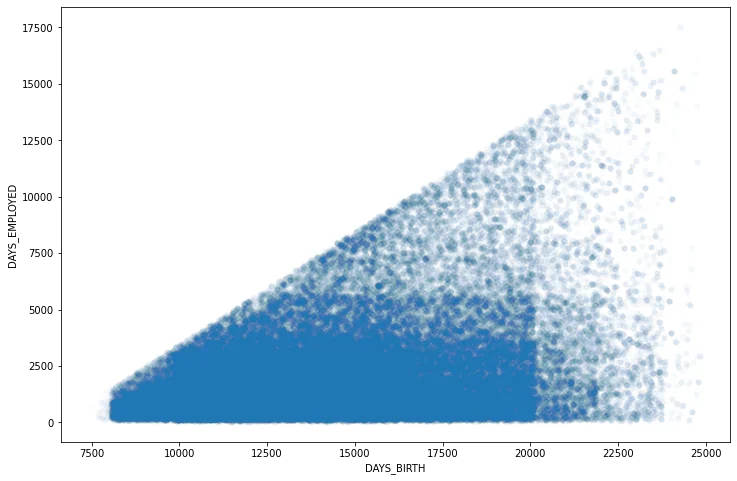
TASK: Recreate the Distribution Plot shown below:

Note, you will need to figure out how to calculate "Age in Years" from one of the columns in the DF. Think carefully about this. Don't worry too much if you are unable to replicate the styling exactly.
# CODE HERE TO RECREATE THE PLOT SHOWN ABOVEplt.figure(figsize=(8,4))
df['YEARS'] = -1*df['DAYS_BIRTH']/365
sns.histplot(data=df,x='YEARS',linewidth=2,edgecolor='black',
color='red',bins=45,alpha=0.4)
plt.xlabel("Age in Years")
plt.savefig('DistPlot_solution.png')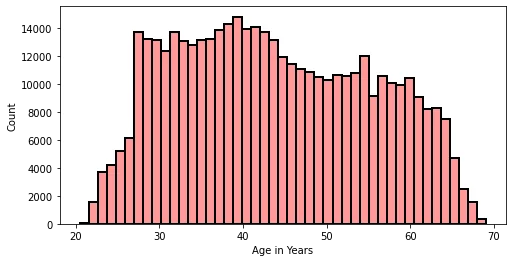
TASK: Recreate the Categorical Plot shown below:
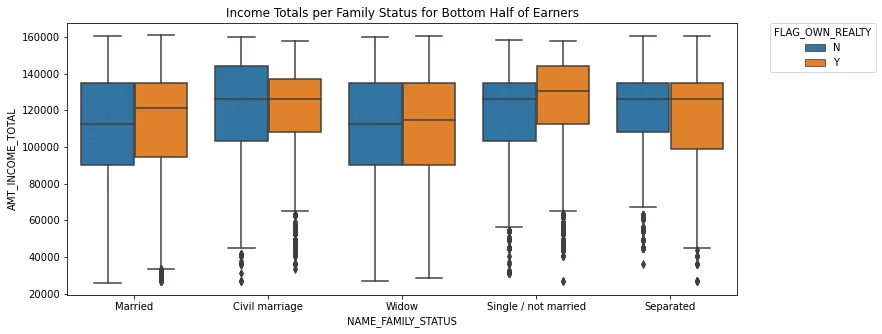
*This plot shows information only for the bottom half of income earners in the data set. It shows the boxplots for each category of NAME_FAMILY_STATUS column for displaying their distribution of their total income. The hue is the "FLAG_OWN_REALTY" column. Note: You will need to adjust or only take part of the dataframe before recreating this plot.*
# CODE HEREplt.figure(figsize=(12,5))
bottom_half_income = df.nsmallest(n=int(0.5*len(df)),columns='AMT_INCOME_TOTAL')
sns.boxplot(x='NAME_FAMILY_STATUS',y='AMT_INCOME_TOTAL',data=bottom_half_income,hue='FLAG_OWN_REALTY')
plt.legend(bbox_to_anchor=(1.05, 1), loc=2, borderaxespad=0.,title='FLAG_OWN_REALTY')
plt.title('Income Totals per Family Status for Bottom Half of Earners')Text(0.5, 1.0, 'Income Totals per Family Status for Bottom Half of Earners')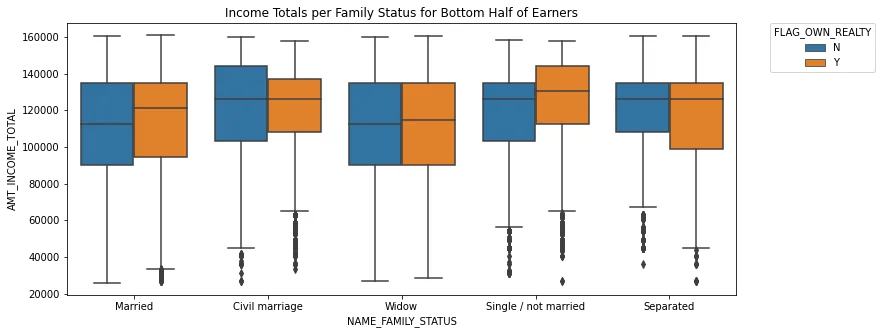
TASK: Recreate the Heat Map shown below:
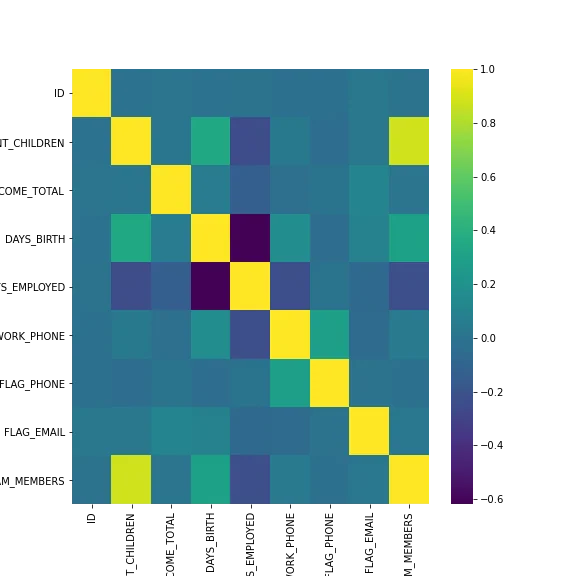
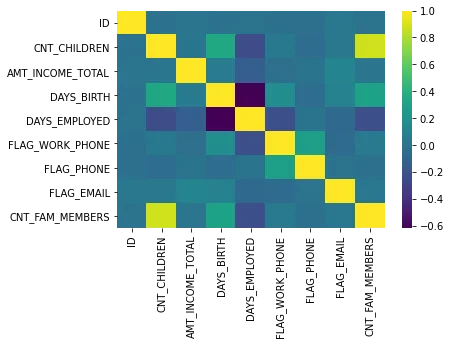
This heatmap shows the correlation between the columns in the dataframe. You can get correlation with .corr() , also note that the FLAG_MOBIL column has NaN correlation with every other column, so you should drop it before calling .corr().
df.corr()ID
CNT_CHILDREN
AMT_INCOME_TOTAL
DAYS_BIRTH
DAYS_EMPLOYED115 more lines
FLAG_MOBIL
FLAG_WORK_PHONE
FLAG_PHONE
FLAG_EMAIL
CNT_FAM_MEMBERS
ID
1.000000
-0.005178
0.011179
-0.004994
-0.002467
NaN
-0.023319
-0.018992
0.032875
-0.001862
CNT_CHILDREN
-0.005178
1.000000
0.019177
0.349088
-0.241535
NaN
0.038418
-0.038266
0.028457
0.884781
AMT_INCOME_TOTAL
0.011179
0.019177
1.000000
0.053775
-0.141291
NaN
-0.033635
0.004444
0.112139
0.011454
DAYS_BIRTH
-0.004994
0.349088
0.053775
1.000000
-0.617908
NaN
0.171829
-0.037984
0.096752
0.306179
DAYS_EMPLOYED
-0.002467
-0.241535
-0.141291
-0.617908
1.000000
NaN
-0.232208
0.004868
-0.074372
-0.234373
FLAG_MOBIL
NaN
NaN
NaN
NaN
NaN
NaN
NaN
NaN
NaN
NaN
FLAG_WORK_PHONE
-0.023319
0.038418
-0.033635
0.171829
-0.232208
NaN
1.000000
0.290066
-0.060915
0.049777
FLAG_PHONE
-0.018992
-0.038266
0.004444
-0.037984
0.004868
NaN
0.290066
1.000000
-0.001170
-0.024213
FLAG_EMAIL
0.032875
0.028457
0.112139
0.096752
-0.074372
NaN
-0.060915
-0.001170
1.000000
0.022054
CNT_FAM_MEMBERS
-0.001862
0.884781
0.011454
0.306179
-0.234373
NaN
0.049777
-0.024213
0.022054
1.000000sns.heatmap(df.drop('FLAG_MOBIL',axis=1).corr(),cmap="viridis")<AxesSubplot:>