Scatter Plots
Scatter plots can show how different features are related to one another, the main theme between all relational plot types is they display how features are interconnected to each other. There are many different types of plots that can be used to show this, so let's explore the scatterplot() as well as general seaborn parameters applicable to other plot types.
Data
We'll use some generated data from: http://roycekimmons.com/tools/generated_data
df = pd.read_csv("dm_office_sales.csv")df.head()division
level of education
training level
work experience
salary36 more lines
sales
0
printers
some college
2
6
91684
372302
1
printers
associate's degree
2
10
119679
495660
2
peripherals
high school
0
9
82045
320453
3
office supplies
associate's degree
2
5
92949
377148
4
office supplies
high school
1
5
71280
312802df.info()<class 'pandas.core.frame.DataFrame'>
RangeIndex: 1000 entries, 0 to 999
Data columns (total 6 columns):
# Column Non-Null Count Dtype
--- ------ -------------- ----- 8 more lines
 0   division            1000 non-null   object
 1   level of education  1000 non-null   object
 2   training level      1000 non-null   int64
 3   work experience     1000 non-null   int64
 4   salary              1000 non-null   int64
 5   sales               1000 non-null   int64
dtypes: int64(4), object(2)
memory usage: 47.0+ KB
Scatterplot
sns.scatterplot(x='salary',y='sales',data=df)<matplotlib.axes._subplots.AxesSubplot at 0x2089e370088>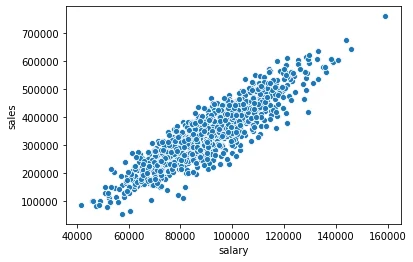
Connecting to Figure in Matplotlib
Note how matplotlib is still connected to seaborn underneath (even without importing matplotlib.pyplot), since seaborn itself is directly making a Figure call with matplotlib. We can import matplotlib.pyplot and make calls to directly effect the seaborn figure.
plt.figure(figsize=(12,8))
sns.scatterplot(x='salary',y='sales',data=df)<matplotlib.axes._subplots.AxesSubplot at 0x2089fb16a08>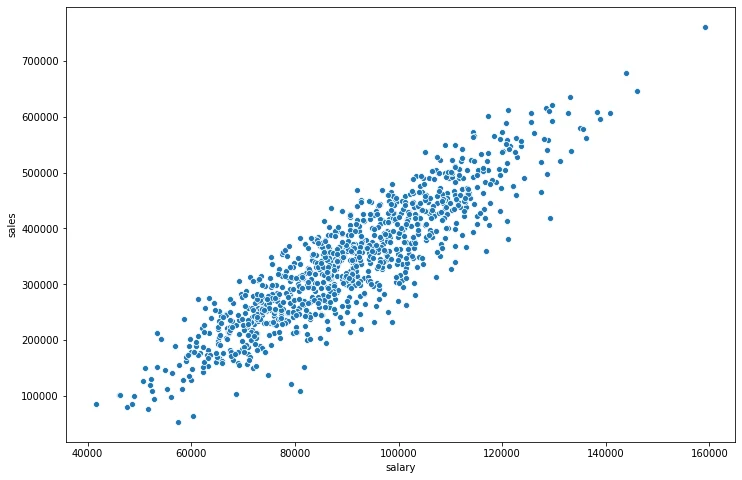
Seaborn Parameters
The hue and palette parameters are commonly available around many plot calls in seaborn.
hue
Color points based off a categorical feature in the DataFrame
plt.figure(figsize=(12,8))
sns.scatterplot(x='salary',y='sales',data=df,hue='division')<matplotlib.axes._subplots.AxesSubplot at 0x2089fb0fe88>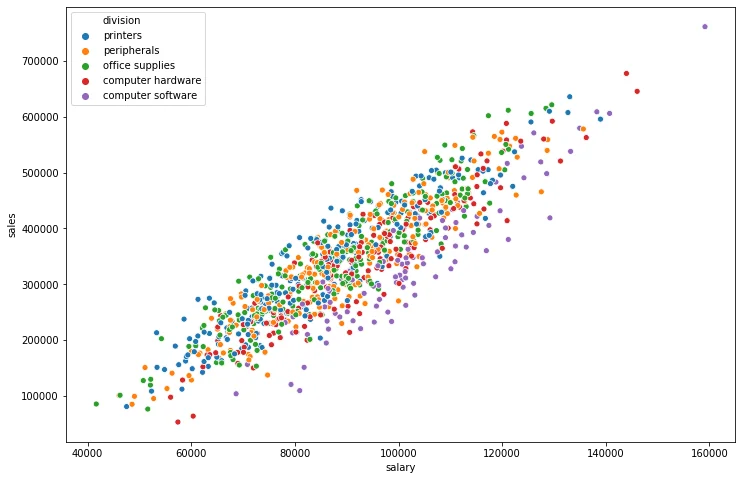
plt.figure(figsize=(12,8))
sns.scatterplot(x='salary',y='sales',data=df,hue='work experience')<matplotlib.axes._subplots.AxesSubplot at 0x2089fc3d848>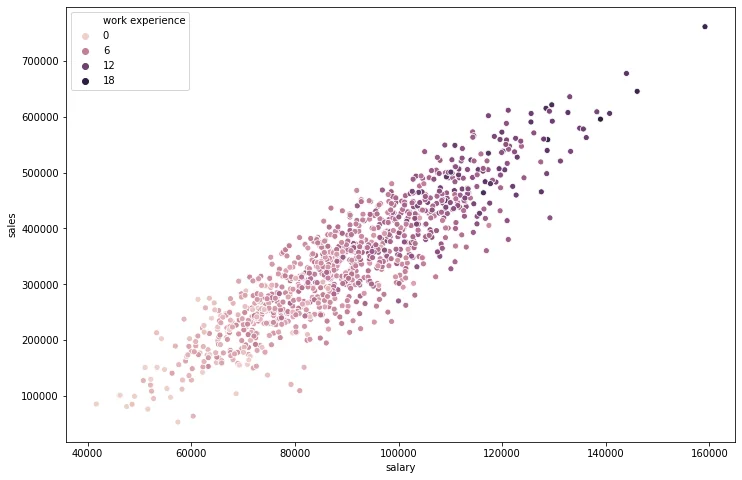
Choosing a palette from Matplotlib's cmap: https://matplotlib.org/tutorials/colors/colormaps.html
plt.figure(figsize=(12,8))
sns.scatterplot(x='salary',y='sales',data=df,hue='work experience',palette='viridis')<matplotlib.axes._subplots.AxesSubplot at 0x2089fcbbdc8>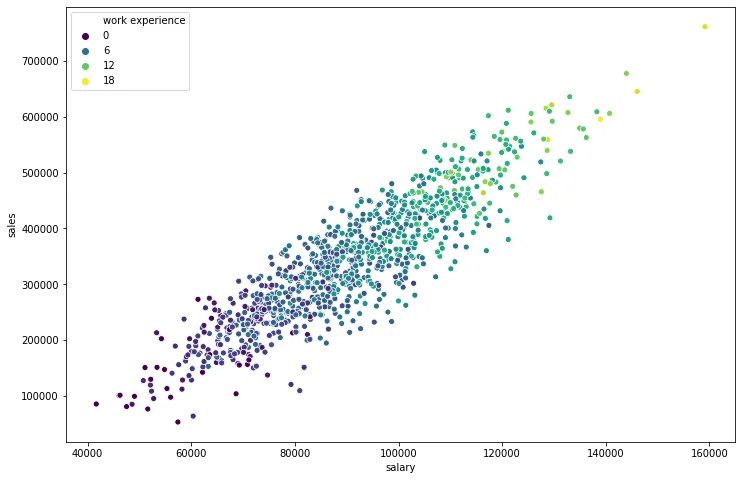
Scatterplot Parameters
These parameters are more specific to the scatterplot() call
size
Allows you to size based on another column
plt.figure(figsize=(12,8))
sns.scatterplot(x='salary',y='sales',data=df,size='work experience')<matplotlib.axes._subplots.AxesSubplot at 0x2089fcb7188>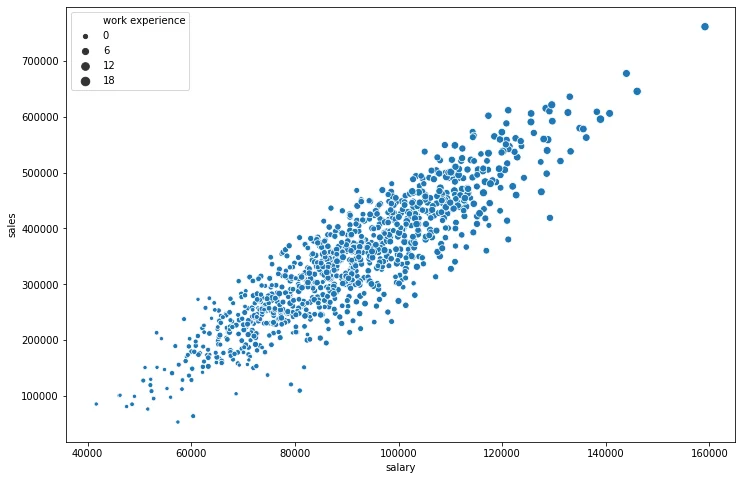
*Use s= if you want to change the marker size to be some uniform integer value*
plt.figure(figsize=(12,8))
sns.scatterplot(x='salary',y='sales',data=df,s=200)<matplotlib.axes._subplots.AxesSubplot at 0x208a00c1708>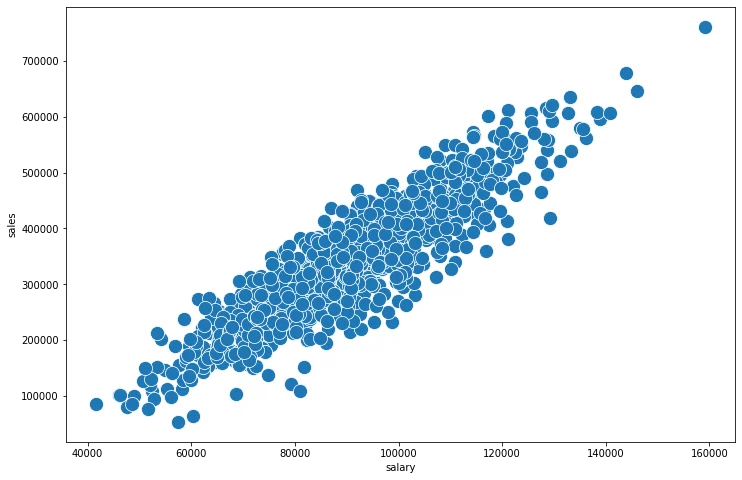
plt.figure(figsize=(12,8))
sns.scatterplot(x='salary',y='sales',data=df,s=200,linewidth=0,alpha=0.2)<matplotlib.axes._subplots.AxesSubplot at 0x208a077b908>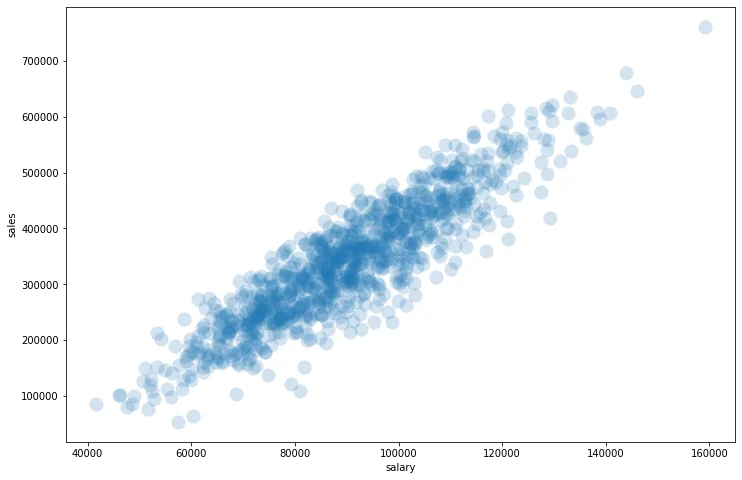
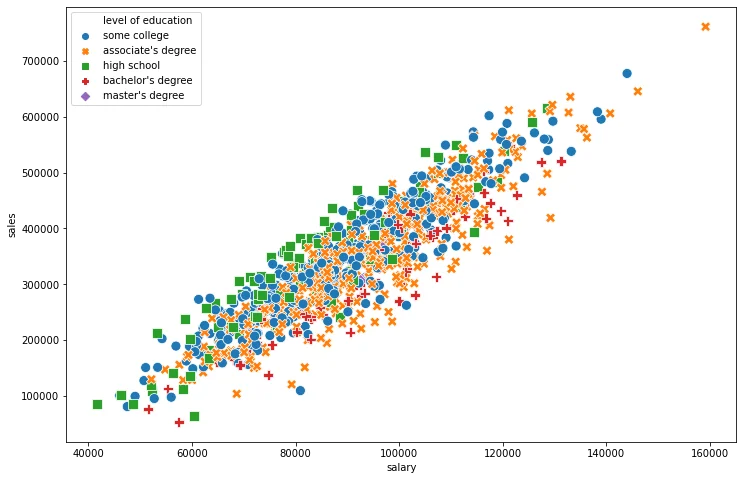
style
Automatically choose styles based on another categorical feature in the dataset. Optionally use the markers= parameter to pass a list of marker choices based off matplotlib, for example: ['*','+','o']
plt.figure(figsize=(12,8))
sns.scatterplot(x='salary',y='sales',data=df,style='level of education')<AxesSubplot:xlabel='salary', ylabel='sales'>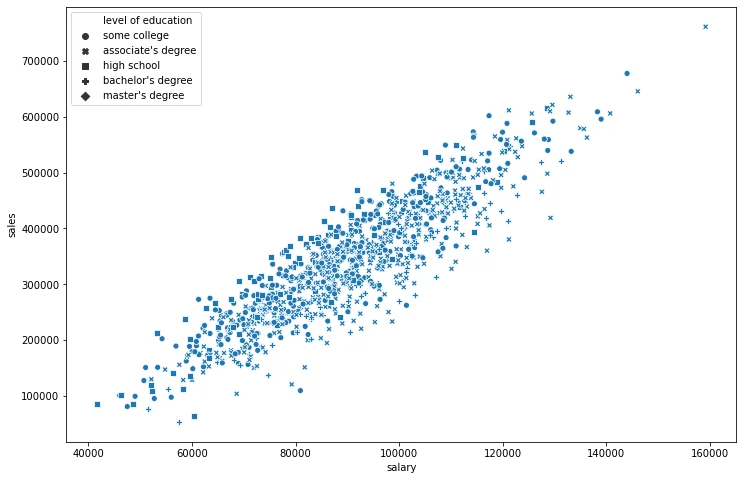
plt.figure(figsize=(12,8))
# Sometimes its nice to do BOTH hue and style off the same column
sns.scatterplot(x='salary',y='sales',data=df,style='level of education',hue='level of education',s=100)<AxesSubplot:xlabel='salary', ylabel='sales'>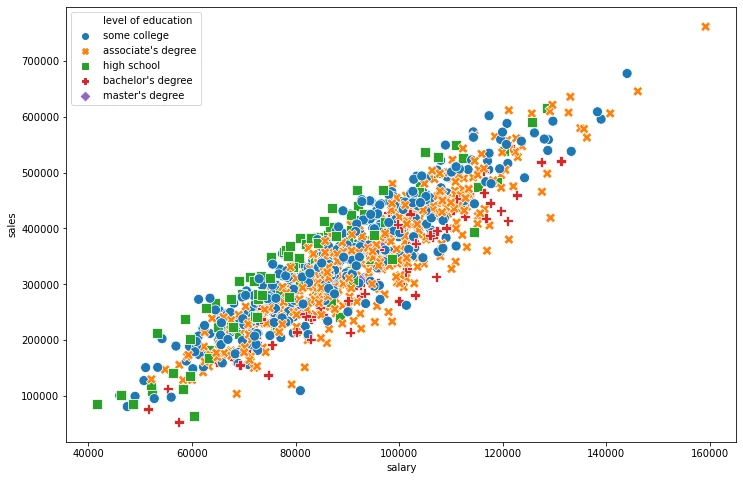
Exporting a Seaborn Figure
plt.figure(figsize=(12,8))
sns.scatterplot(x='salary',y='sales',data=df,style='level of education',hue='level of education',s=100)

# Call savefig in the same cell
plt.savefig('example_scatter.jpg')