Grids
Imports
The Data
df = pd.read_csv('StudentsPerformance.csv')df.head()gender
race/ethnicity
parental level of education
lunch
test preparation course48 more lines
math score
reading score
writing score
0
female
group B
bachelor's degree
standard
none
72
72
74
1
female
group C
some college
standard
completed
69
90
88
2
female
group B
master's degree
standard
none
90
95
93
3
male
group A
associate's degree
free/reduced
none
47
57
44
4
male
group C
some college
standard
none
76
78
75
catplot()
# Kind Options are: “point”, “bar”, “strip”, “swarm”, “box”, “violin”, or “boxen”
sns.catplot(x='gender',y='math score',data=df,kind='box')<seaborn.axisgrid.FacetGrid at 0x1e24e235b08>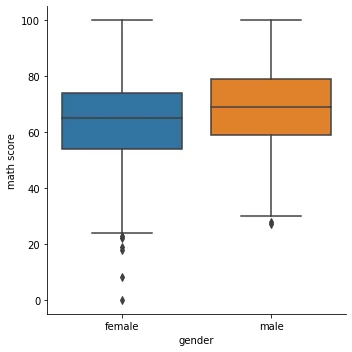
sns.catplot(x='gender',y='math score',data=df,kind='box',row='lunch')<seaborn.axisgrid.FacetGrid at 0x1e24e37b2c8>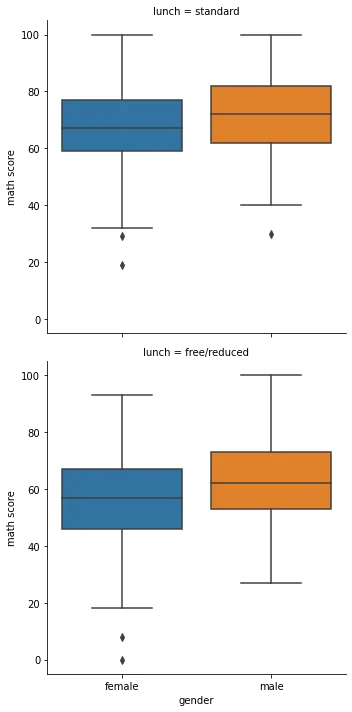
sns.catplot(x='gender',y='math score',data=df,kind='box',row='lunch',col='test preparation course')<seaborn.axisgrid.FacetGrid at 0x1e24e856388>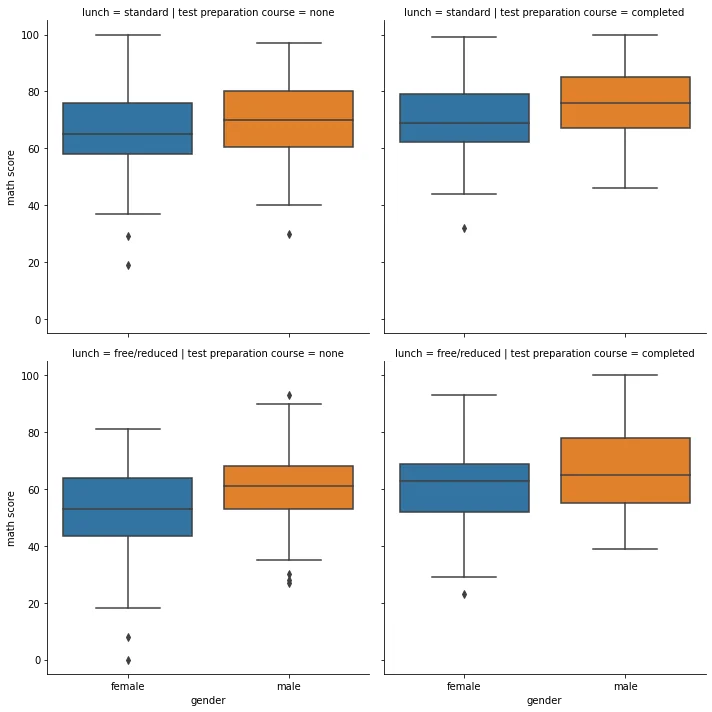
Pairgrid
Grid that pairplot is built on top of, allows for heavy customization of the pairplot seen earlier.
g = sns.PairGrid(df)
g = g.map_upper(sns.scatterplot)
g = g.map_diag(sns.kdeplot, lw=2)
g = g.map_lower(sns.kdeplot, colors="red")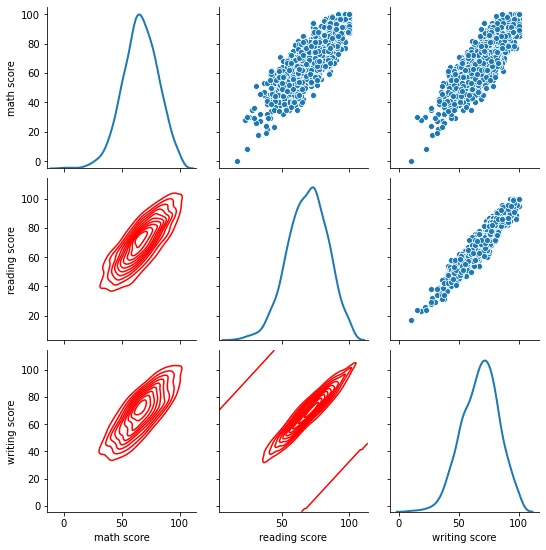
g = sns.PairGrid(df, hue="gender", palette="viridis",hue_kws={"marker": ["o", "+"]})
g = g.map_upper(sns.scatterplot, linewidths=1, edgecolor="w", s=40)
g = g.map_diag(sns.distplot)
g = g.map_lower(sns.kdeplot)
g = g.add_legend();

# Safely ignore the warning, its telling you it didn't use the marker for kde plotc:\users\marcial\anaconda3\envs\ml_master\lib\site-packages\seaborn\distributions.py:434: UserWarning: The following kwargs were not used by contour: 'marker'
cset = contour_func(xx, yy, z, n_levels, **kwargs)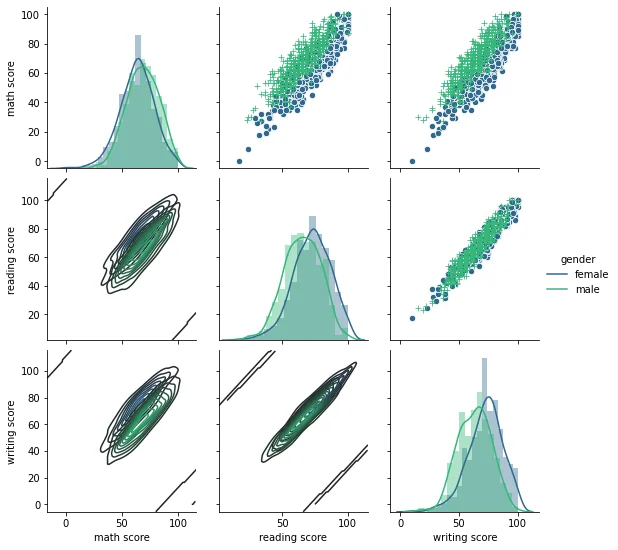
FacetGrid
sns.FacetGrid(data=df,col='gender',row='lunch')<seaborn.axisgrid.FacetGrid at 0x1e24be00748>
g = sns.FacetGrid(data=df,col='gender',row='lunch')
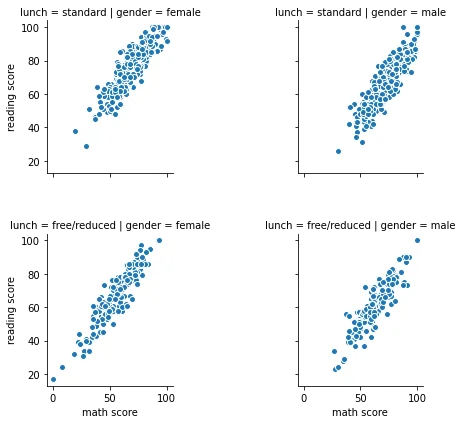
g = g.map(plt.scatter, "math score", "reading score", edgecolor="w")
g.add_legend()<seaborn.axisgrid.FacetGrid at 0x1e24f4fcb08>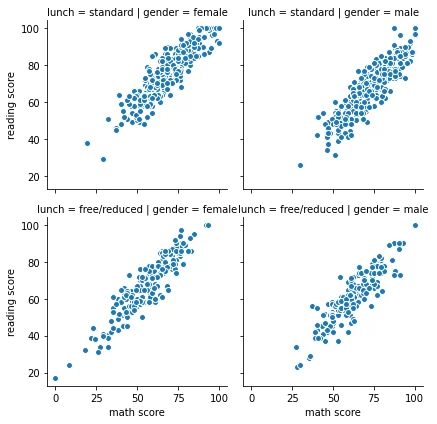
# https://stackoverflow.com/questions/43669229/increase-space-between-rows-on-facetgrid-plotg = sns.FacetGrid(data=df,col='gender',row='lunch')
g = g.map(plt.scatter, "math score", "reading score", edgecolor="w")
g.add_legend()
plt.subplots_adjust(hspace=0.4, wspace=1)