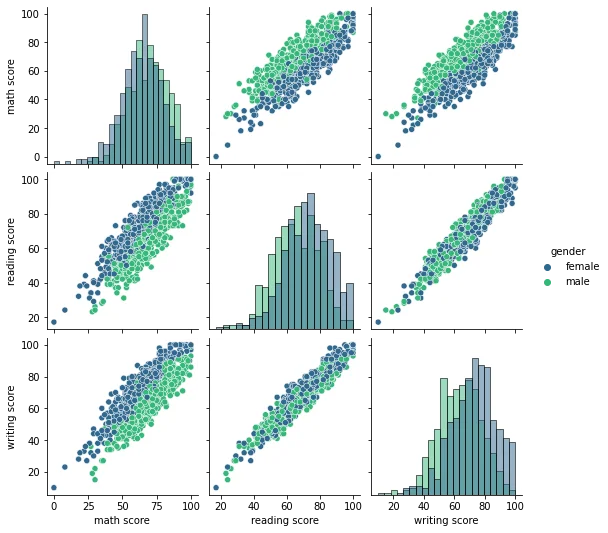
Comparison Plots with pairplot() and jointplot()
Imports
The Data
df = pd.read_csv("StudentsPerformance.csv")df.head()gender
race/ethnicity
parental level of education
lunch
test preparation course48 more lines
math score
reading score
writing score
0
female
group B
bachelor's degree
standard
none
72
72
74
1
female
group C
some college
standard
completed
69
90
88
2
female
group B
master's degree
standard
none
90
95
93
3
male
group A
associate's degree
free/reduced
none
47
57
44
4
male
group C
some college
standard
none
76
78
75
jointplot
sns.jointplot(x='math score',y='reading score',data=df)<seaborn.axisgrid.JointGrid at 0x23f9ed8dd08>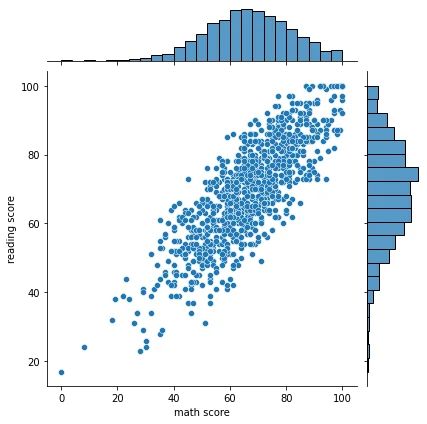
sns.jointplot(x='math score',y='reading score',data=df,kind='hex')<seaborn.axisgrid.JointGrid at 0x23fa1027308>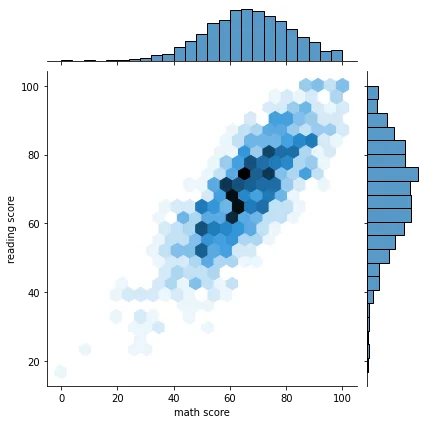
sns.jointplot(x='math score',y='reading score',data=df,kind='kde')<seaborn.axisgrid.JointGrid at 0x23fa11d4108>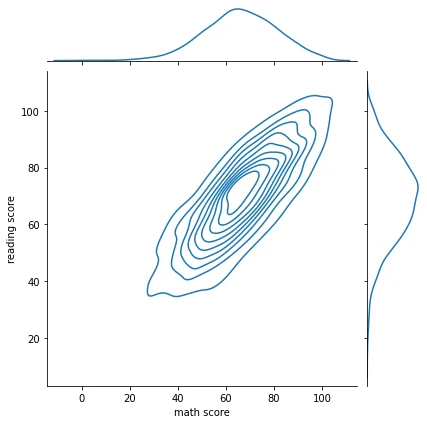
pairplot
sns.pairplot(df)<seaborn.axisgrid.PairGrid at 0x23fa12eb608>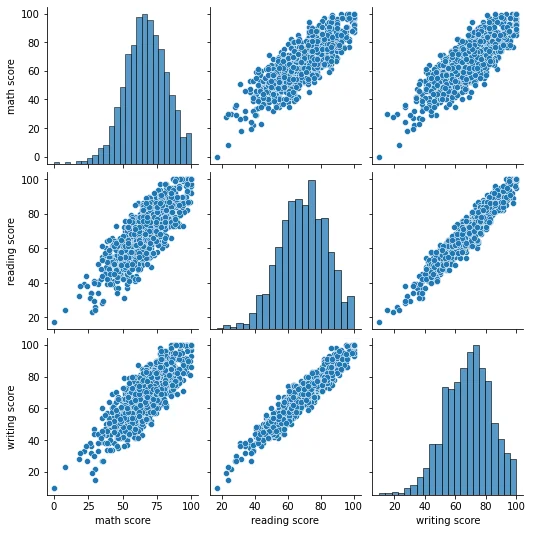
sns.pairplot(df,hue='gender',palette='viridis')<seaborn.axisgrid.PairGrid at 0x23fa18c8908>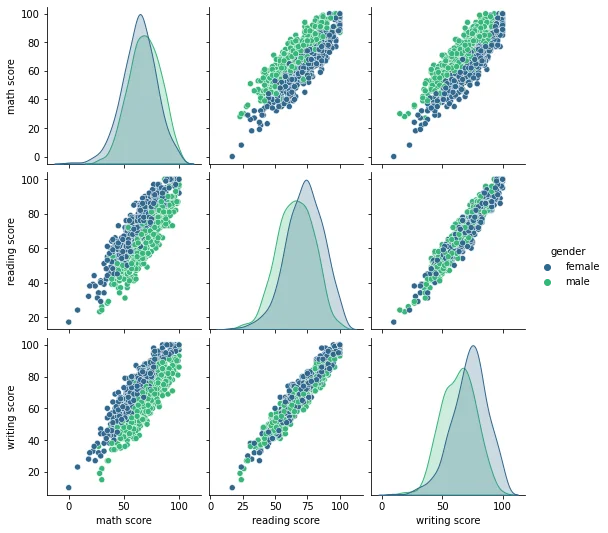
sns.pairplot(df,hue='gender',palette='viridis',corner=True)<seaborn.axisgrid.PairGrid at 0x23fa1e07948>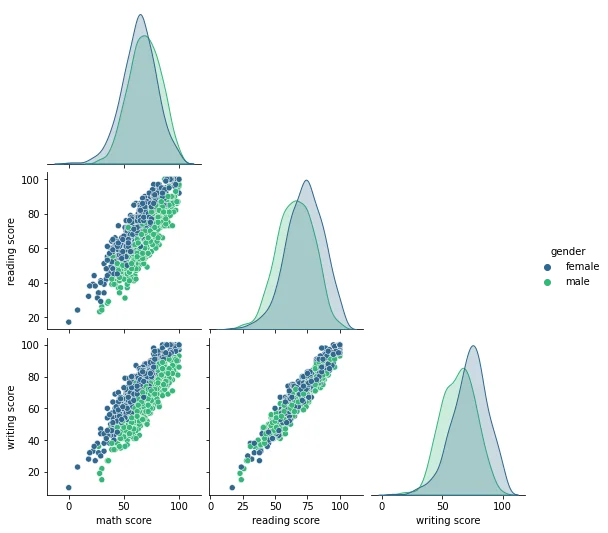
sns.pairplot(df,hue='gender',palette='viridis',diag_kind='hist')<seaborn.axisgrid.PairGrid at 0x23fa190ef88>