df = pd.read_csv('../DATA/gene_expression.csv')df.head()Gene One
Gene Two
Cancer Present
0
4.318 more lines
3.9
1
1
2.5
6.3
0
2
5.7
3.9
1
3
6.1
6.2
0
4
7.4
3.4
1sns.scatterplot(x='Gene One', y='Gene Two', hue='Cancer Present', data=df, alpha=0.6)<Axes: xlabel='Gene One', ylabel='Gene Two'>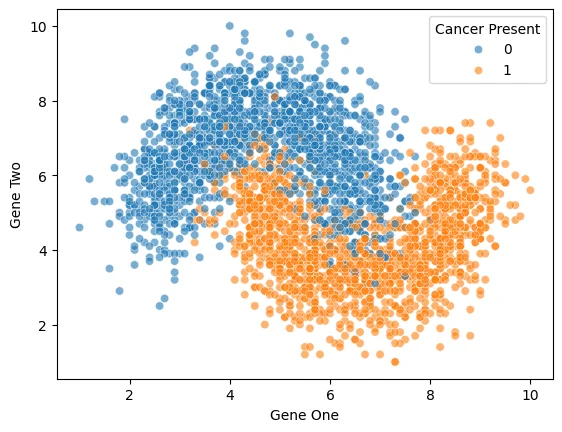
sns.scatterplot(x='Gene One',y='Gene Two',hue='Cancer Present',data=df, alpha=0.6)

plt.xlim(2,6)
plt.ylim(3,10)(3.0, 10.0)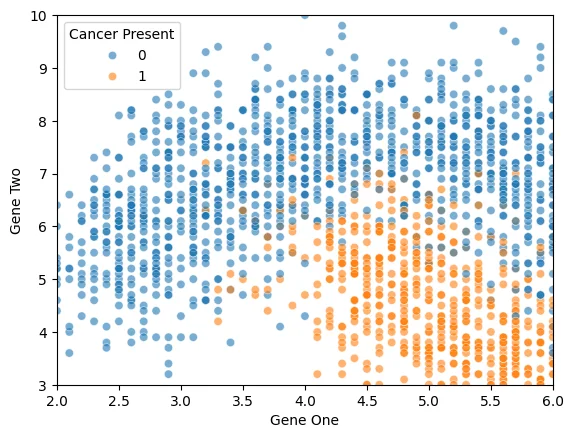
from sklearn.model_selection import train_test_split
from sklearn.preprocessing import StandardScalerX = df.drop('Cancer Present',axis=1)
y = df['Cancer Present']X_train, X_test, y_train, y_test = train_test_split(X, y, test_size=0.3, random_state=42)scaler = StandardScaler()