KNN Project Exercise - Solutions
Due to the simplicity of KNN for Classification, let's focus on using a PipeLine and a GridSearchCV tool, since these skills can be generalized for any model.
The Sonar Data
Detecting a Rock or a Mine
Sonar (sound navigation ranging) is a technique that uses sound propagation (usually underwater, as in submarine navigation) to navigate, communicate with or detect objects on or under the surface of the water, such as other vessels.
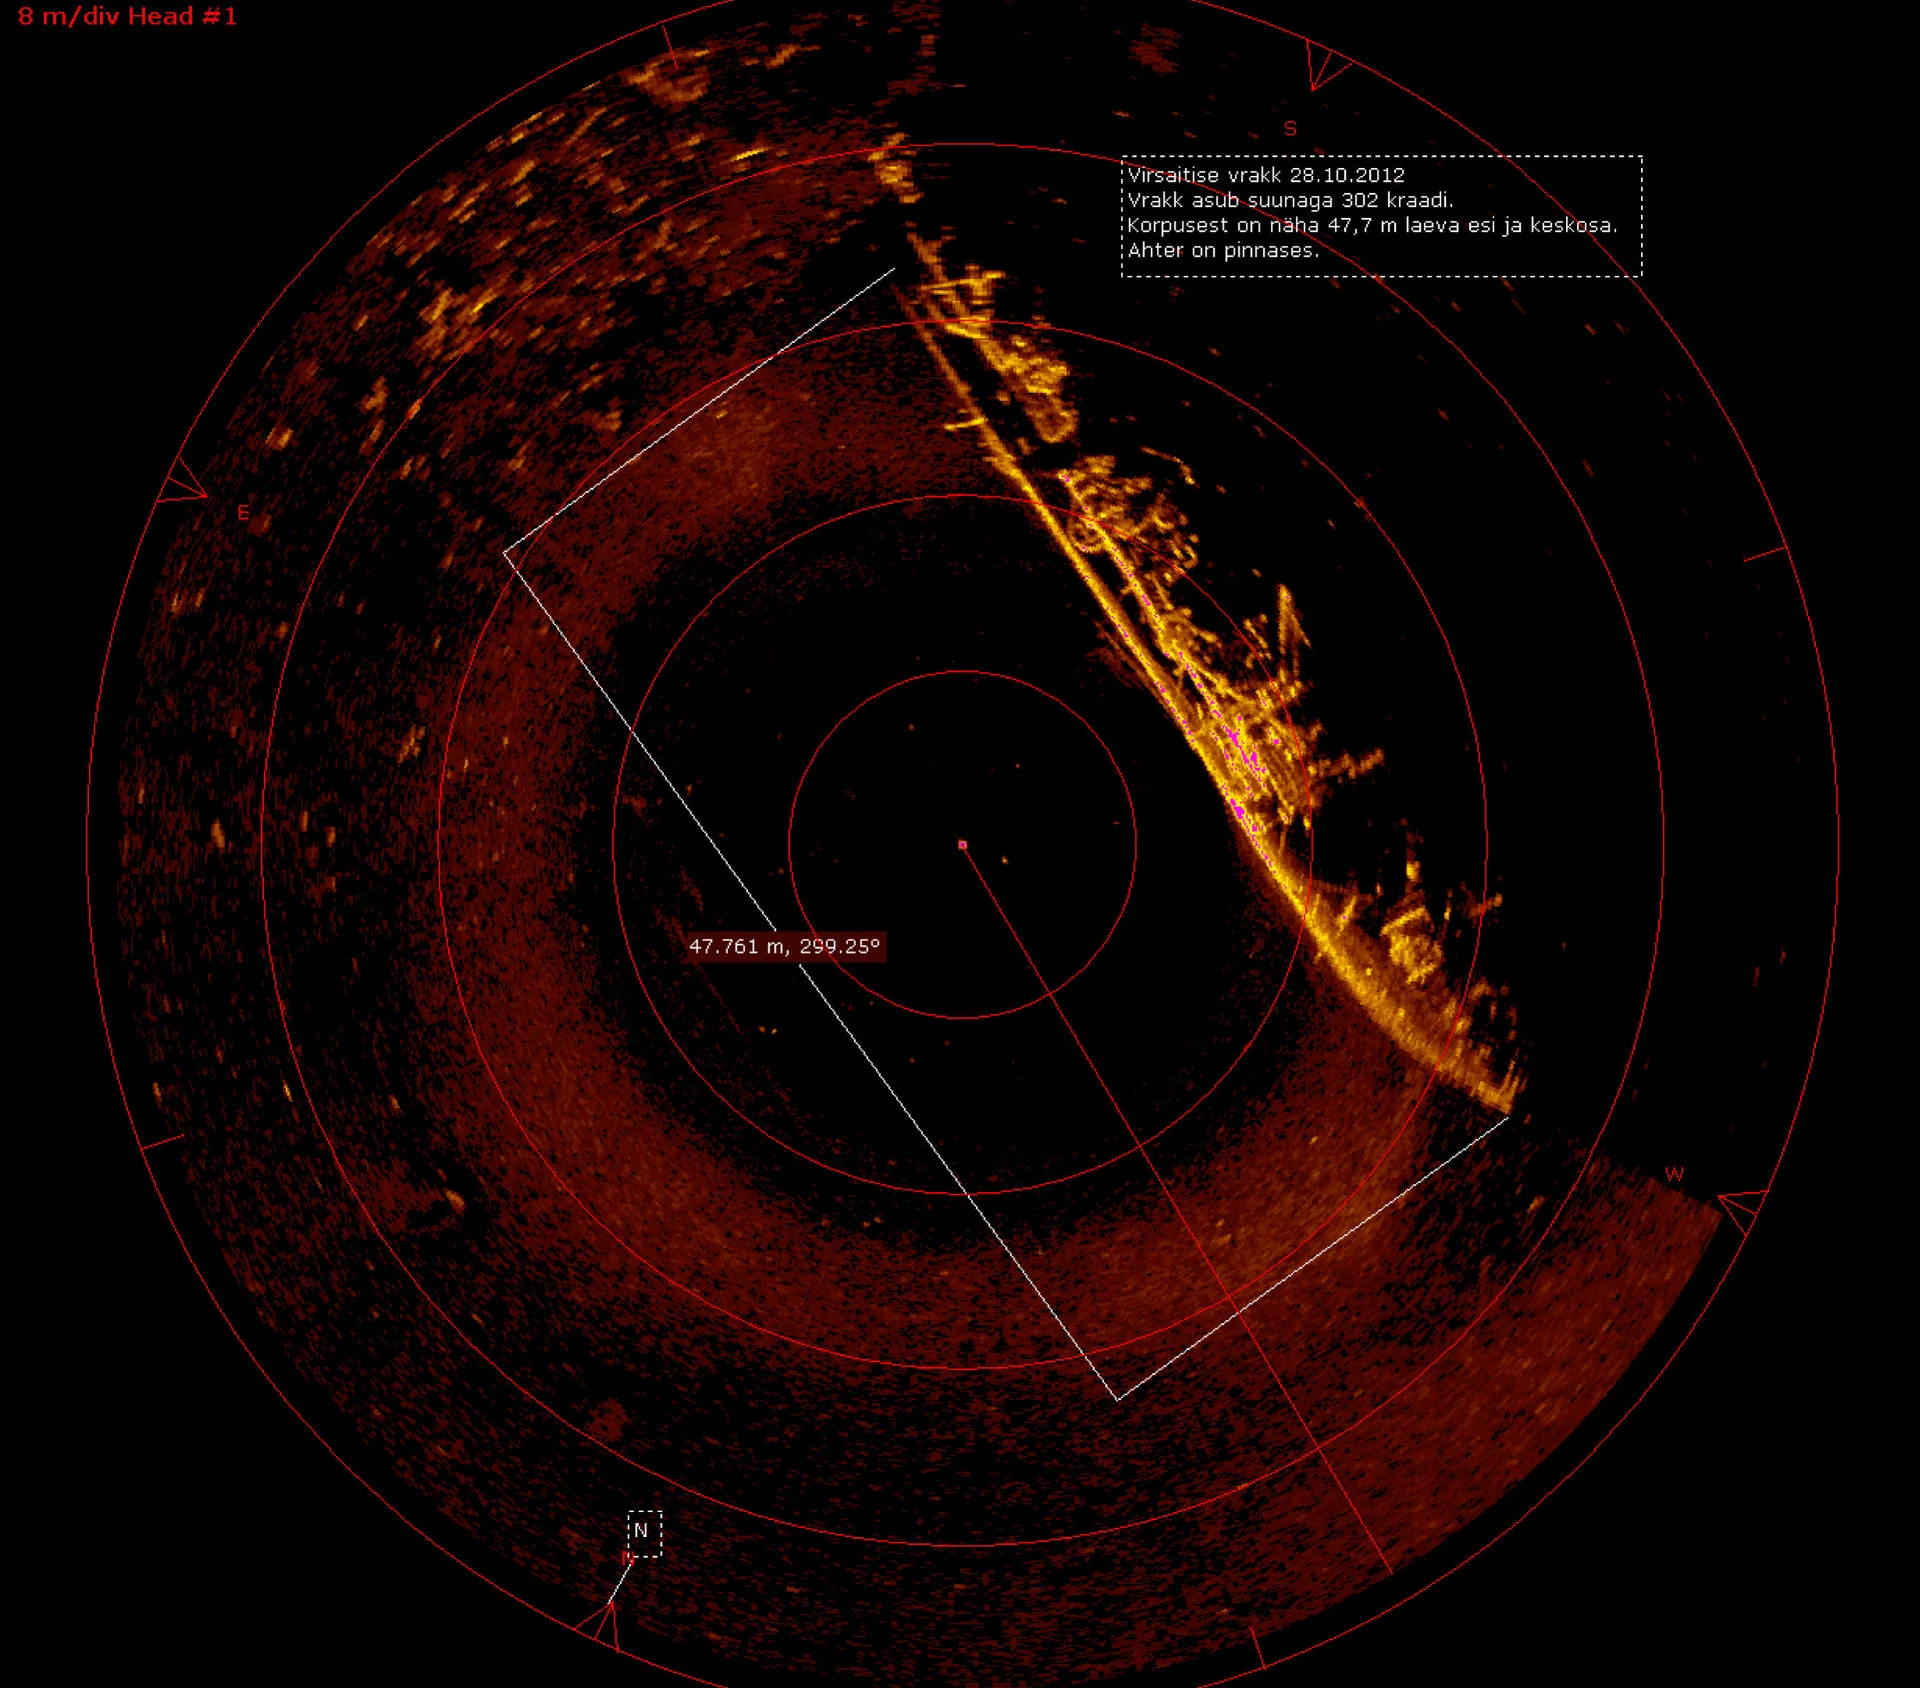
The data set contains the response metrics for 60 separate sonar frequencies sent out against a known mine field (and known rocks). These frequencies are then labeled with the known object they were beaming the sound at (either a rock or a mine).
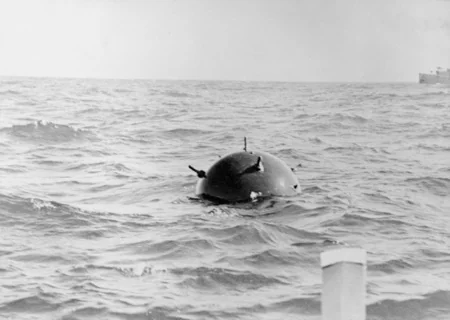
Our main goal is to create a machine learning model capable of detecting the difference between a rock or a mine based on the response of the 60 separate sonar frequencies.
Data Source: https://archive.ics.uci.edu/ml/datasets/Connectionist+Bench+(Sonar,+Mines+vs.+Rocks)
Complete the Tasks in bold
TASK: Run the cells below to load the data.
df = pd.read_csv('../DATA/sonar.all-data.csv')df.head()Freq_1
Freq_2
Freq_3
Freq_4
Freq_5127 more lines
Freq_6
Freq_7
Freq_8
Freq_9
Freq_10
...
Freq_52
Freq_53
Freq_54
Freq_55
Freq_56
Freq_57
Freq_58
Freq_59
Freq_60
Label
0
0.0200
0.0371
0.0428
0.0207
0.0954
0.0986
0.1539
0.1601
0.3109
0.2111
...
0.0027
0.0065
0.0159
0.0072
0.0167
0.0180
0.0084
0.0090
0.0032
R
1
0.0453
0.0523
0.0843
0.0689
0.1183
0.2583
0.2156
0.3481
0.3337
0.2872
...
0.0084
0.0089
0.0048
0.0094
0.0191
0.0140
0.0049
0.0052
0.0044
R
2
0.0262
0.0582
0.1099
0.1083
0.0974
0.2280
0.2431
0.3771
0.5598
0.6194
...
0.0232
0.0166
0.0095
0.0180
0.0244
0.0316
0.0164
0.0095
0.0078
R
3
0.0100
0.0171
0.0623
0.0205
0.0205
0.0368
0.1098
0.1276
0.0598
0.1264
...
0.0121
0.0036
0.0150
0.0085
0.0073
0.0050
0.0044
0.0040
0.0117
R
4
0.0762
0.0666
0.0481
0.0394
0.0590
0.0649
0.1209
0.2467
0.3564
0.4459
...
0.0031
0.0054
0.0105
0.0110
0.0015
0.0072
0.0048
0.0107
0.0094
R
5 rows × 61 columns
Data Exploration
TASK: Create a heatmap of the correlation between the difference frequency responses.
# CODE HEREplt.figure(figsize=(8,6))
sns.heatmap(df.corr(),cmap='coolwarm')<AxesSubplot:>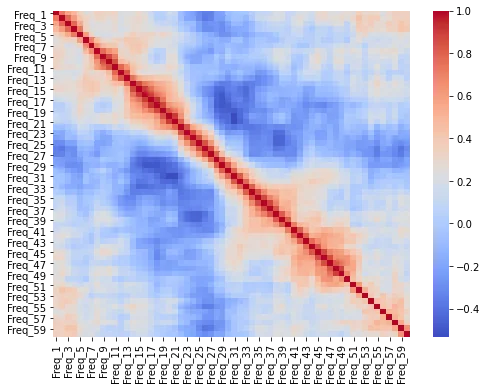
TASK: What are the top 5 correlated frequencies with the target\label?
Note: You many need to map the label to 0s and 1s.
*Additional Note: We're looking for absolute correlation values.*
#CODE HEREdf['Target'] = df['Label'].map({'R':0,'M':1})np.abs(df.corr()['Target']).sort_values().tail(6)Freq_45 0.339406
Freq_10 0.341142
Freq_49 0.351312
Freq_12 0.392245
Freq_11 0.4328552 more lines
Target     1.000000
Name: Target, dtype: float64
Train | Test Split
Our approach here will be one of using Cross Validation on 90% of the dataset, and then judging our results on a final test set of 10% to evaluate our model.
TASK: Split the data into features and labels, and then split into a training set and test set, with 90% for Cross-Validation training, and 10% for a final test set.
# CODE HEREfrom sklearn.model_selection import train_test_splitX = df.drop(['Target','Label'],axis=1)
y = df['Label']X_cv, X_test, y_cv, y_test = train_test_split(X, y, test_size=0.1, random_state=42)TASK: Create a PipeLine that contains both a StandardScaler and a KNN model
from sklearn.preprocessing import StandardScaler
from sklearn.neighbors import KNeighborsClassifierscaler = StandardScaler()knn = KNeighborsClassifier()operations = [('scaler',scaler),('knn',knn)]from sklearn.pipeline import Pipelinepipe = Pipeline(operations)TASK: Perform a grid-search with the pipeline to test various values of k and report back the best performing parameters.
from sklearn.model_selection import GridSearchCVk_values = list(range(1,30))param_grid = {'knn__n_neighbors': k_values}full_cv_classifier = GridSearchCV(pipe,param_grid,cv=5,scoring='accuracy')full_cv_classifier.fit(X_cv,y_cv)GridSearchCV(cv=5,
estimator=Pipeline(steps=[('scaler', StandardScaler()),
('knn', KNeighborsClassifier())]),
param_grid={'knn__n_neighbors': [1, 2, 3, 4, 5, 6, 7, 8, 9, 10, 11,
12, 13, 14, 15, 16, 17, 18, 19,3 more lines
                                              20, 21, 22, 23, 24, 25, 26, 27,
                                              28, 29]},
scoring='accuracy')full_cv_classifier.best_estimator_.get_params(){'memory': None,
'steps': [('scaler', StandardScaler()),
('knn', KNeighborsClassifier(n_neighbors=1))],
'verbose': False,
'scaler': StandardScaler(),12 more lines
 'knn': KNeighborsClassifier(n_neighbors=1),
 'scaler__copy': True,
 'scaler__with_mean': True,
 'scaler__with_std': True,
 'knn__algorithm': 'auto',
 'knn__leaf_size': 30,
 'knn__metric': 'minkowski',
 'knn__metric_params': None,
 'knn__n_jobs': None,
 'knn__n_neighbors': 1,
 'knn__p': 2,
 'knn__weights': 'uniform'}
(HARD) TASK: Using the .cv_results_ dictionary, see if you can create a plot of the mean test scores per K value.
#CODE HEREfull_cv_classifier.cv_results_['mean_test_score']array([0.84537696, 0.78065434, 0.77524893, 0.75917496, 0.75931721,
0.74822191, 0.75945946, 0.71664296, 0.7113798 , 0.68421053,
0.70042674, 0.68435277, 0.68449502, 0.67908962, 0.69530583,
0.68990043, 0.7113798 , 0.70042674, 0.72204836, 0.67908962,
0.70071124, 0.69530583, 0.69530583, 0.68463727, 0.68477952,1 more line
0.67923186, 0.67411095, 0.65775249, 0.6685633 ])scores = full_cv_classifier.cv_results_['mean_test_score']
plt.plot(k_values,scores,'o-')
plt.xlabel("K")
plt.ylabel("Accuracy")Text(0, 0.5, 'Accuracy')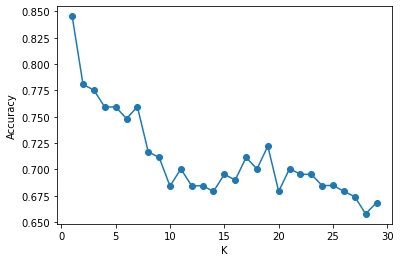
Final Model Evaluation
TASK: Using the grid classifier object from the previous step, get a final performance classification report and confusion matrix.
#Code Herepred = full_cv_classifier.predict(X_test)from sklearn.metrics import classification_report,confusion_matrix,accuracy_scoreconfusion_matrix(y_test,pred)array([[12, 1],
[ 1, 7]], dtype=int64)print(classification_report(y_test,pred)) precision recall f1-score support
M 0.92 0.92 0.92 13
R 0.88 0.88 0.88 8
3 more lines
    accuracy                           0.90        21
   macro avg       0.90      0.90      0.90        21
weighted avg       0.90      0.90      0.90        21