Logarithmic scale
It is also possible to set a logarithmic scale for one or both axes. This functionality is in fact only one application of a more general transformation system in Matplotlib. Each of the axes' scales are set seperately using set_xscale{:python} and set_yscale{:python} methods which accept one parameter (with the value "log" in this case):
fig, axes = plt.subplots(1, 2, figsize=(10,4))

axes[0].plot(x, x**2, x, np.exp(x))
axes[0].set_title("Normal scale")

axes[1].plot(x, x**2, x, np.exp(x))
axes[1].set_yscale("log")
axes[1].set_title("Logarithmic scale (y)");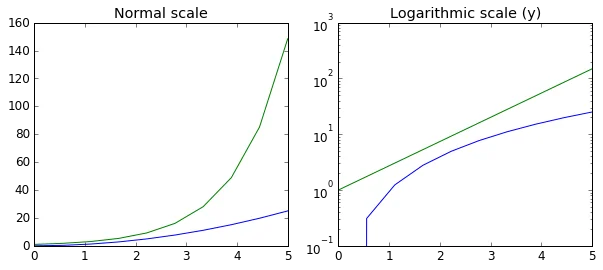
Placement of ticks and custom tick labels
We can explicitly determine where we want the axis ticks with set_xticks{:python} and set_yticks{:python}, which both take a list of values for where on the axis the ticks are to be placed. We can also use the set_xticklabels{:python} and set_yticklabels{:python} methods to provide a list of custom text labels for each tick location:
fig, ax = plt.subplots(figsize=(10, 4))

ax.plot(x, x**2, x, x**3, lw=2)

ax.set_xticks([1, 2, 3, 4, 5])
ax.set_xticklabels([r'$\alpha$', r'$\beta$', r'$\gamma$', r'$\delta$', r'$\epsilon$'], fontsize=18)

yticks = [0, 50, 100, 150]
ax.set_yticks(yticks)
ax.set_yticklabels(["$%.1f$" % y for y in yticks], fontsize=18); # use LaTeX formatted labels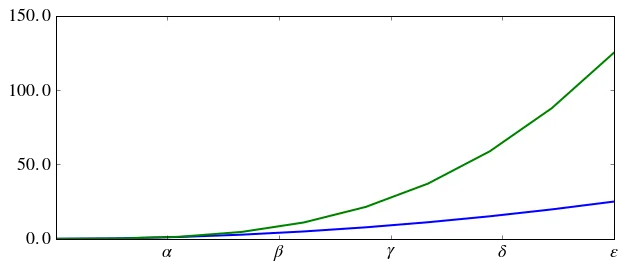
There are a number of more advanced methods for controlling major and minor tick placement in matplotlib figures, such as automatic placement according to different policies. See http://matplotlib.org/api/ticker_api.html for details.
Scientific notation
With large numbers on axes, it is often better use scientific notation:
fig, ax = plt.subplots(1, 1)

ax.plot(x, x**2, x, np.exp(x))
ax.set_title("scientific notation")

ax.set_yticks([0, 50, 100, 150])

from matplotlib import ticker
formatter = ticker.ScalarFormatter(useMathText=True)
formatter.set_scientific(True)
formatter.set_powerlimits((-1,1))
ax.yaxis.set_major_formatter(formatter)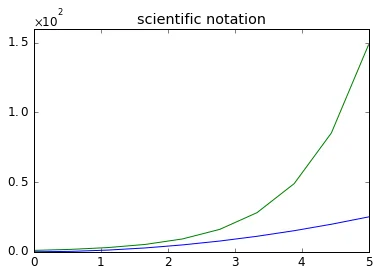
Axis number and axis label spacing
# distance between x and y axis and the numbers on the axes
matplotlib.rcParams['xtick.major.pad'] = 5
matplotlib.rcParams['ytick.major.pad'] = 5

fig, ax = plt.subplots(1, 1)

ax.plot(x, x**2, x, np.exp(x))
ax.set_yticks([0, 50, 100, 150])

ax.set_title("label and axis spacing")

# padding between axis label and axis numbers
ax.xaxis.labelpad = 5
ax.yaxis.labelpad = 5

ax.set_xlabel("x")
ax.set_ylabel("y");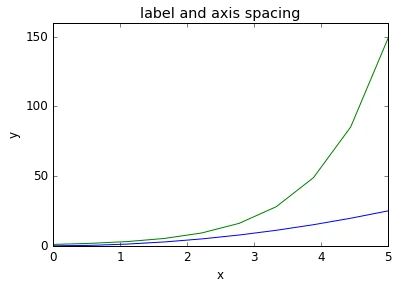
# restore defaults
matplotlib.rcParams['xtick.major.pad'] = 3
matplotlib.rcParams['ytick.major.pad'] = 3
Axis position adjustments
Unfortunately, when saving figures the labels are sometimes clipped, and it can be necessary to adjust the positions of axes a little bit. This can be done using subplots_adjust{:python}:
fig, ax = plt.subplots(1, 1)

ax.plot(x, x**2, x, np.exp(x))
ax.set_yticks([0, 50, 100, 150])

ax.set_title("title")
ax.set_xlabel("x")
ax.set_ylabel("y")

fig.subplots_adjust(left=0.15, right=.9, bottom=0.1, top=0.9);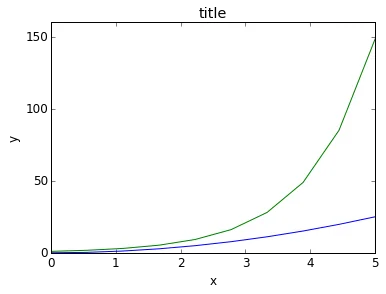
Axis grid
With the grid{:python} method in the axis object, we can turn on and off grid lines. We can also customize the appearance of the grid lines using the same keyword arguments as the plot{:python} function:
fig, axes = plt.subplots(1, 2, figsize=(10,3))

# default grid appearance
axes[0].plot(x, x**2, x, x**3, lw=2)
axes[0].grid(True)

# custom grid appearance
axes[1].plot(x, x**2, x, x**3, lw=2)
axes[1].grid(color='b', alpha=0.5, linestyle='dashed', linewidth=0.5)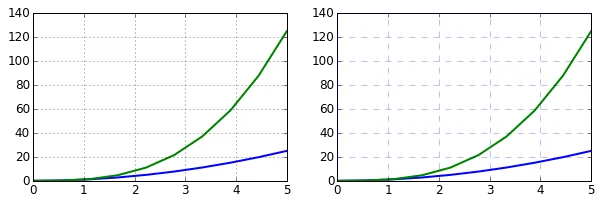
Axis spines
We can also change the properties of axis spines:
fig, ax = plt.subplots(figsize=(6,2))

ax.spines['bottom'].set_color('blue')
ax.spines['top'].set_color('blue')

ax.spines['left'].set_color('red')
ax.spines['left'].set_linewidth(2)

# turn off axis spine to the right
ax.spines['right'].set_color("none")
ax.yaxis.tick_left() # only ticks on the left side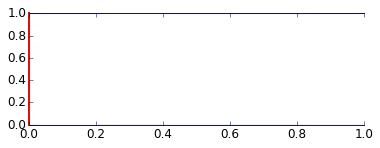
Twin axes
Sometimes it is useful to have dual x or y axes in a figure; for example, when plotting curves with different units together. Matplotlib supports this with the twinx{:python} and twiny{:python} functions:
fig, ax1 = plt.subplots()

ax1.plot(x, x**2, lw=2, color="blue")
ax1.set_ylabel(r"area $(m^2)$", fontsize=18, color="blue")
for label in ax1.get_yticklabels():
    label.set_color("blue")

ax2 = ax1.twinx()
ax2.plot(x, x**3, lw=2, color="red")
ax2.set_ylabel(r"volume $(m^3)$", fontsize=18, color="red")
for label in ax2.get_yticklabels():
    label.set_color("red")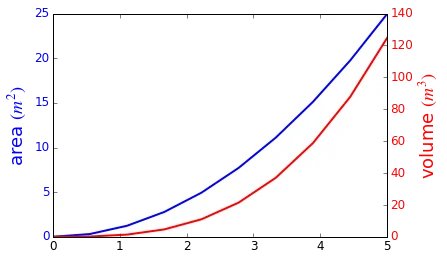
Axes where x and y is zero
fig, ax = plt.subplots()

ax.spines['right'].set_color('none')
ax.spines['top'].set_color('none')

ax.xaxis.set_ticks_position('bottom')
ax.spines['bottom'].set_position(('data',0)) # set position of x spine to x=0

ax.yaxis.set_ticks_position('left')
ax.spines['left'].set_position(('data',0))   # set position of y spine to y=0

xx = np.linspace(-0.75, 1., 100)
ax.plot(xx, xx**3);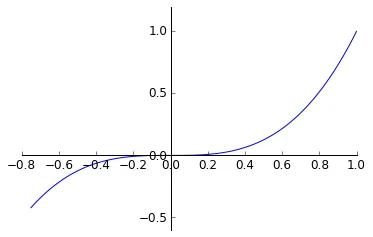
Other 2D plot styles
In addition to the regular plot{:python} method, there are a number of other functions for generating different kind of plots. See the matplotlib plot gallery for a complete list of available plot types: http://matplotlib.org/gallery.html. Some of the more useful ones are show below:
n = np.array([0,1,2,3,4,5])fig, axes = plt.subplots(1, 4, figsize=(12,3))
axes[0].scatter(xx, xx + 0.25*np.random.randn(len(xx)))
axes[0].set_title("scatter")
axes[1].step(n, n**2, lw=2)
axes[1].set_title("step")
axes[2].bar(n, n**2, align="center", width=0.5, alpha=0.5)
axes[2].set_title("bar")
axes[3].fill_between(x, x**2, x**3, color="green", alpha=0.5);
axes[3].set_title("fill_between");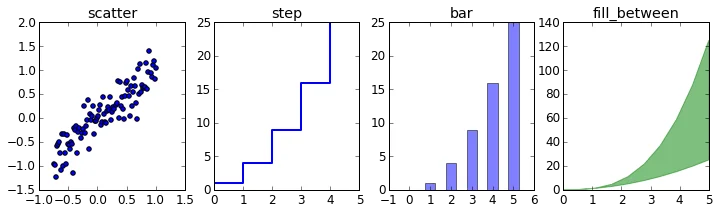
Text annotation
Annotating text in matplotlib figures can be done using the text{:python} function. It supports LaTeX formatting just like axis label texts and titles:
fig, ax = plt.subplots()

ax.plot(xx, xx**2, xx, xx**3)

ax.text(0.15, 0.2, r"$y=x^2$", fontsize=20, color="blue")
ax.text(0.65, 0.1, r"$y=x^3$", fontsize=20, color="green");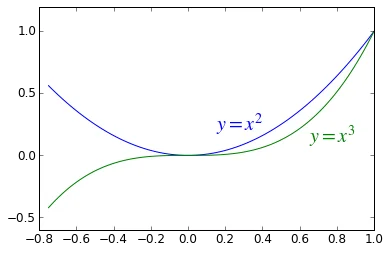
Figures with multiple subplots and insets
Axes can be added to a matplotlib Figure canvas manually using fig.add_axes{:python} or using a sub-figure layout manager such as subplots{:python}, subplot2grid{:python}, or gridspec{:python}:
subplots
fig, ax = plt.subplots(2, 3)
fig.tight_layout()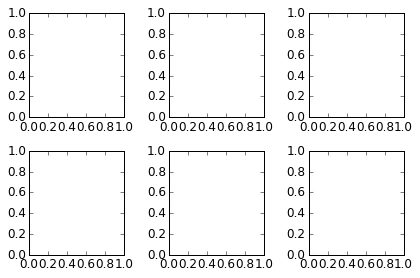
subplot2grid
fig = plt.figure()
ax1 = plt.subplot2grid((3,3), (0,0), colspan=3)
ax2 = plt.subplot2grid((3,3), (1,0), colspan=2)
ax3 = plt.subplot2grid((3,3), (1,2), rowspan=2)
ax4 = plt.subplot2grid((3,3), (2,0))
ax5 = plt.subplot2grid((3,3), (2,1))
fig.tight_layout()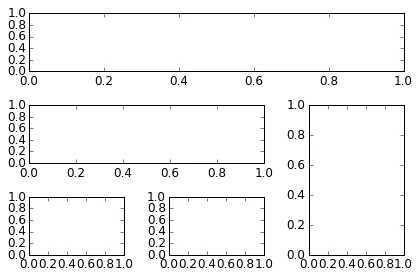
gridspec
fig = plt.figure()

gs = gridspec.GridSpec(2, 3, height_ratios=[2,1], width_ratios=[1,2,1])
for g in gs:
    ax = fig.add_subplot(g)

fig.tight_layout()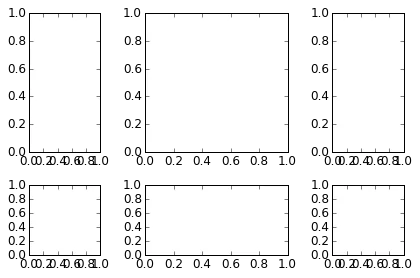
add_axes
Manually adding axes with add_axes{:python} is useful for adding insets to figures:
fig, ax = plt.subplots()

ax.plot(xx, xx**2, xx, xx**3)
fig.tight_layout()

# inset
inset_ax = fig.add_axes([0.2, 0.55, 0.35, 0.35]) # X, Y, width, height

inset_ax.plot(xx, xx**2, xx, xx**3)
inset_ax.set_title('zoom near origin')

# set axis range
inset_ax.set_xlim(-.2, .2)
inset_ax.set_ylim(-.005, .01)

# set axis tick locations
inset_ax.set_yticks([0, 0.005, 0.01])
inset_ax.set_xticks([-0.1,0,.1]);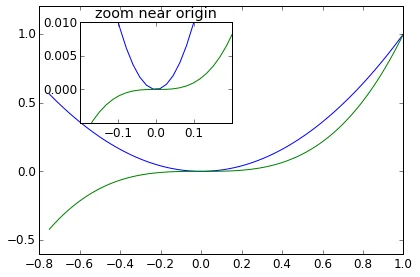
Colormap and contour figures
Colormaps and contour figures are useful for plotting functions of two variables. In most of these functions we will use a colormap to encode one dimension of the data. There are a number of predefined colormaps. It is relatively straightforward to define custom colormaps. For a list of pre-defined colormaps, see: http://www.scipy.org/Cookbook/Matplotlib/Show_colormaps
alpha = 0.7
phi_ext = 2 * np.pi * 0.5

def flux_qubit_potential(phi_m, phi_p):
return 2 + alpha - 2 * np.cos(phi_p) * np.cos(phi_m) - alpha * np.cos(phi_ext - 2*phi_p)phi_m = np.linspace(0, 2*np.pi, 100)
phi_p = np.linspace(0, 2*np.pi, 100)
X,Y = np.meshgrid(phi_p, phi_m)
Z = flux_qubit_potential(X, Y).Tpcolor
fig, ax = plt.subplots()

p = ax.pcolor(X/(2*np.pi), Y/(2*np.pi), Z, cmap=matplotlib.cm.RdBu, vmin=abs(Z).min(), vmax=abs(Z).max())
cb = fig.colorbar(p, ax=ax)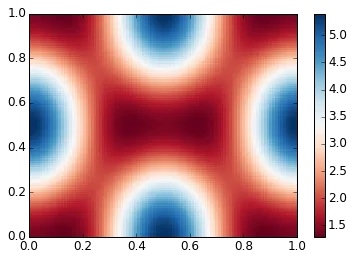
imshow
fig, ax = plt.subplots()

im = ax.imshow(Z, cmap=matplotlib.cm.RdBu, vmin=abs(Z).min(), vmax=abs(Z).max(), extent=[0, 1, 0, 1])
im.set_interpolation('bilinear')

cb = fig.colorbar(im, ax=ax)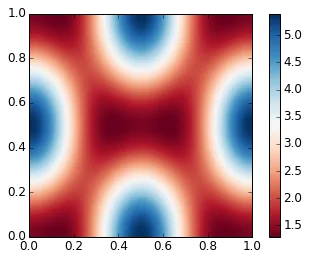
contour
fig, ax = plt.subplots()

cnt = ax.contour(Z, cmap=matplotlib.cm.RdBu, vmin=abs(Z).min(), vmax=abs(Z).max(), extent=[0, 1, 0, 1])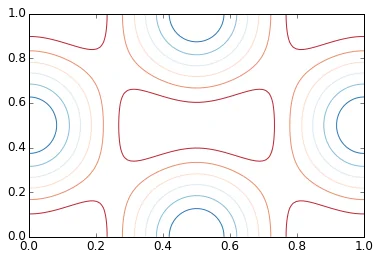
3D figures
To use 3D graphics in matplotlib, we first need to create an instance of the Axes3D{:python} class. 3D axes can be added to a matplotlib figure canvas in exactly the same way as 2D axes; or, more conveniently, by passing a projection='3d'{:python} keyword argument to the add_axes{:python} or add_subplot{:python} methods.
from mpl_toolkits.mplot3d.axes3d import Axes3DSurface plots
fig = plt.figure(figsize=(14,6))

# `ax` is a 3D-aware axis instance because of the projection='3d' keyword argument to add_subplot
ax = fig.add_subplot(1, 2, 1, projection='3d')

p = ax.plot_surface(X, Y, Z, rstride=4, cstride=4, linewidth=0)

# surface_plot with color grading and color bar
ax = fig.add_subplot(1, 2, 2, projection='3d')
p = ax.plot_surface(X, Y, Z, rstride=1, cstride=1, cmap=matplotlib.cm.coolwarm, linewidth=0, antialiased=False)
cb = fig.colorbar(p, shrink=0.5)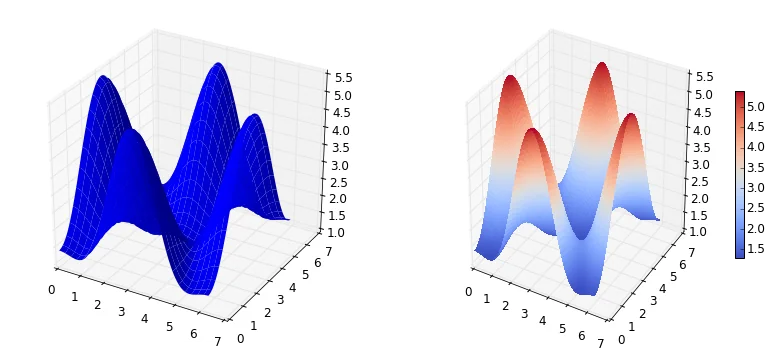
Wire-frame plot
fig = plt.figure(figsize=(8,6))

ax = fig.add_subplot(1, 1, 1, projection='3d')

p = ax.plot_wireframe(X, Y, Z, rstride=4, cstride=4)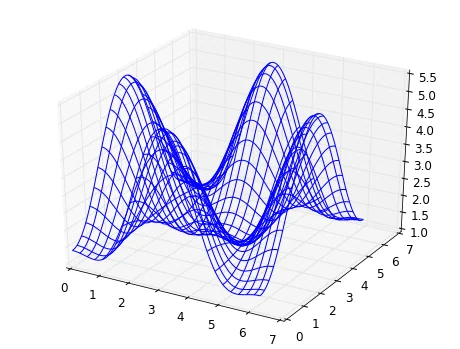
Coutour plots with projections
fig = plt.figure(figsize=(8,6))

ax = fig.add_subplot(1,1,1, projection='3d')

ax.plot_surface(X, Y, Z, rstride=4, cstride=4, alpha=0.25)
cset = ax.contour(X, Y, Z, zdir='z', offset=-np.pi, cmap=matplotlib.cm.coolwarm)
cset = ax.contour(X, Y, Z, zdir='x', offset=-np.pi, cmap=matplotlib.cm.coolwarm)
cset = ax.contour(X, Y, Z, zdir='y', offset=3*np.pi, cmap=matplotlib.cm.coolwarm)

ax.set_xlim3d(-np.pi, 2*np.pi);
ax.set_ylim3d(0, 3*np.pi);
ax.set_zlim3d(-np.pi, 2*np.pi);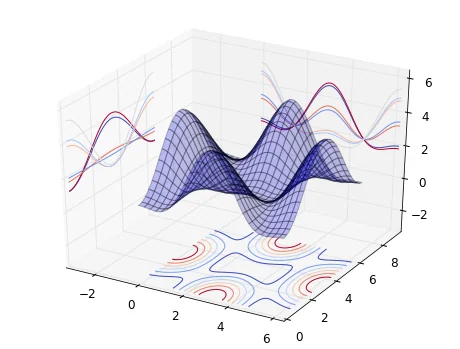
Further reading
- http://www.matplotlib.org - The project web page for matplotlib.
- https://github.com/matplotlib/matplotlib - The source code for matplotlib.
- http://matplotlib.org/gallery.html - A large gallery showcaseing various types of plots matplotlib can create. Highly recommended!