DBSCAN Project Solutions
The Data
Source: https://archive.ics.uci.edu/ml/datasets/Wholesale+customers
Margarida G. M. S. Cardoso, margarida.cardoso '@' iscte.pt, ISCTE-IUL, Lisbon, Portugal
Data Set Information:
Provide all relevant information about your data set.
Attribute Information:
- FRESH: annual spending (m.u.) on fresh products (Continuous);
- MILK: annual spending (m.u.) on milk products (Continuous);
- GROCERY: annual spending (m.u.)on grocery products (Continuous);
- FROZEN: annual spending (m.u.)on frozen products (Continuous)
- DETERGENTS_PAPER: annual spending (m.u.) on detergents and paper products (Continuous)
- DELICATESSEN: annual spending (m.u.)on and delicatessen products (Continuous);
- CHANNEL: customers Channel - Horeca (Hotel/Restaurant/Café) or Retail channel (Nominal)
- REGION: customers Region Lisnon, Oporto or Other (Nominal)
Relevant Papers:
Cardoso, Margarida G.M.S. (2013). Logical discriminant models – Chapter 8 in Quantitative Modeling in Marketing and Management Edited by Luiz Moutinho and Kun-Huang Huarng. World Scientific. p. 223-253. ISBN 978-9814407717
Jean-Patrick Baudry, Margarida Cardoso, Gilles Celeux, Maria José Amorim, Ana Sousa Ferreira (2012). Enhancing the selection of a model-based clustering with external qualitative variables. RESEARCH REPORT N° 8124, October 2012, Project-Team SELECT. INRIA Saclay - Île-de-France, Projet select, Université Paris-Sud 11
DBSCAN and Clustering Examples
COMPLETE THE TASKS IN BOLD BELOW:
TASK: Run the following cells to import the data and view the DataFrame.
df = pd.read_csv('../DATA/wholesome_customers_data.csv')df.head()Channel
Region
Fresh
Milk
Grocery48 more lines
Frozen
Detergents_Paper
Delicassen
0
2
3
12669
9656
7561
214
2674
1338
1
2
3
7057
9810
9568
1762
3293
1776
2
2
3
6353
8808
7684
2405
3516
7844
3
1
3
13265
1196
4221
6404
507
1788
4
2
3
22615
5410
7198
3915
1777
5185df.info()<class 'pandas.core.frame.DataFrame'>
RangeIndex: 440 entries, 0 to 439
Data columns (total 8 columns):
# Column Non-Null Count Dtype
--- ------ -------------- -----10 more lines
 0   Channel           440 non-null    int64
 1   Region            440 non-null    int64
 2   Fresh             440 non-null    int64
 3   Milk              440 non-null    int64
 4   Grocery           440 non-null    int64
 5   Frozen            440 non-null    int64
 6   Detergents_Paper  440 non-null    int64
 7   Delicassen        440 non-null    int64
dtypes: int64(8)
memory usage: 27.6 KB
EDA
TASK: Create a scatterplot showing the relation between MILK and GROCERY spending, colored by Channel column.
#CODE HEREsns.scatterplot(data=df,x='Milk',y='Grocery',hue='Channel')<AxesSubplot:xlabel='Milk', ylabel='Grocery'>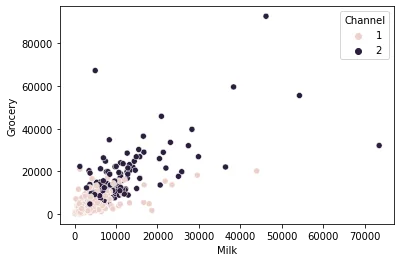
TASK: Use seaborn to create a histogram of MILK spending, colored by Channel. Can you figure out how to use seaborn to "stack" the channels, instead of have them overlap?
#CODE HEREsns.histplot(df,x='Milk',hue='Channel',multiple="stack")<AxesSubplot:xlabel='Milk', ylabel='Count'>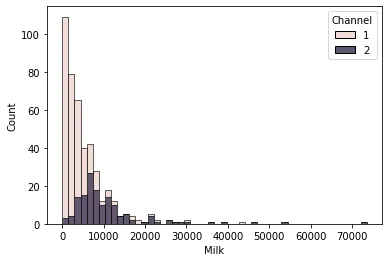
TASK: Create an annotated clustermap of the correlations between spending on different cateogires.
# CODE HEREprint('Correlation Between Spending Categories')
sns.clustermap(df.drop(['Region','Channel'],axis=1).corr(),annot=True);Correlation Between Spending Categories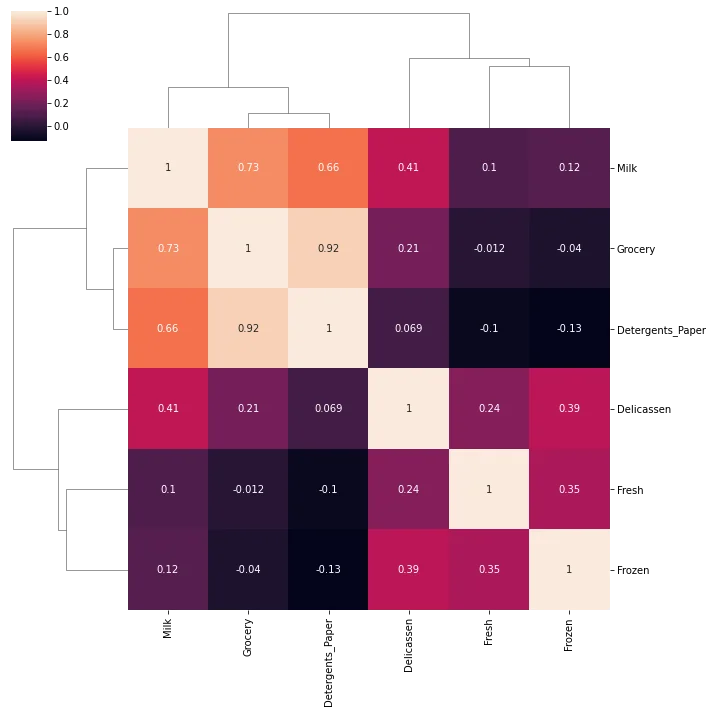
TASK: Create a PairPlot of the dataframe, colored by Region.
#CODE HEREsns.pairplot(df,hue='Region',palette='Set1')<seaborn.axisgrid.PairGrid at 0x2d711759c40>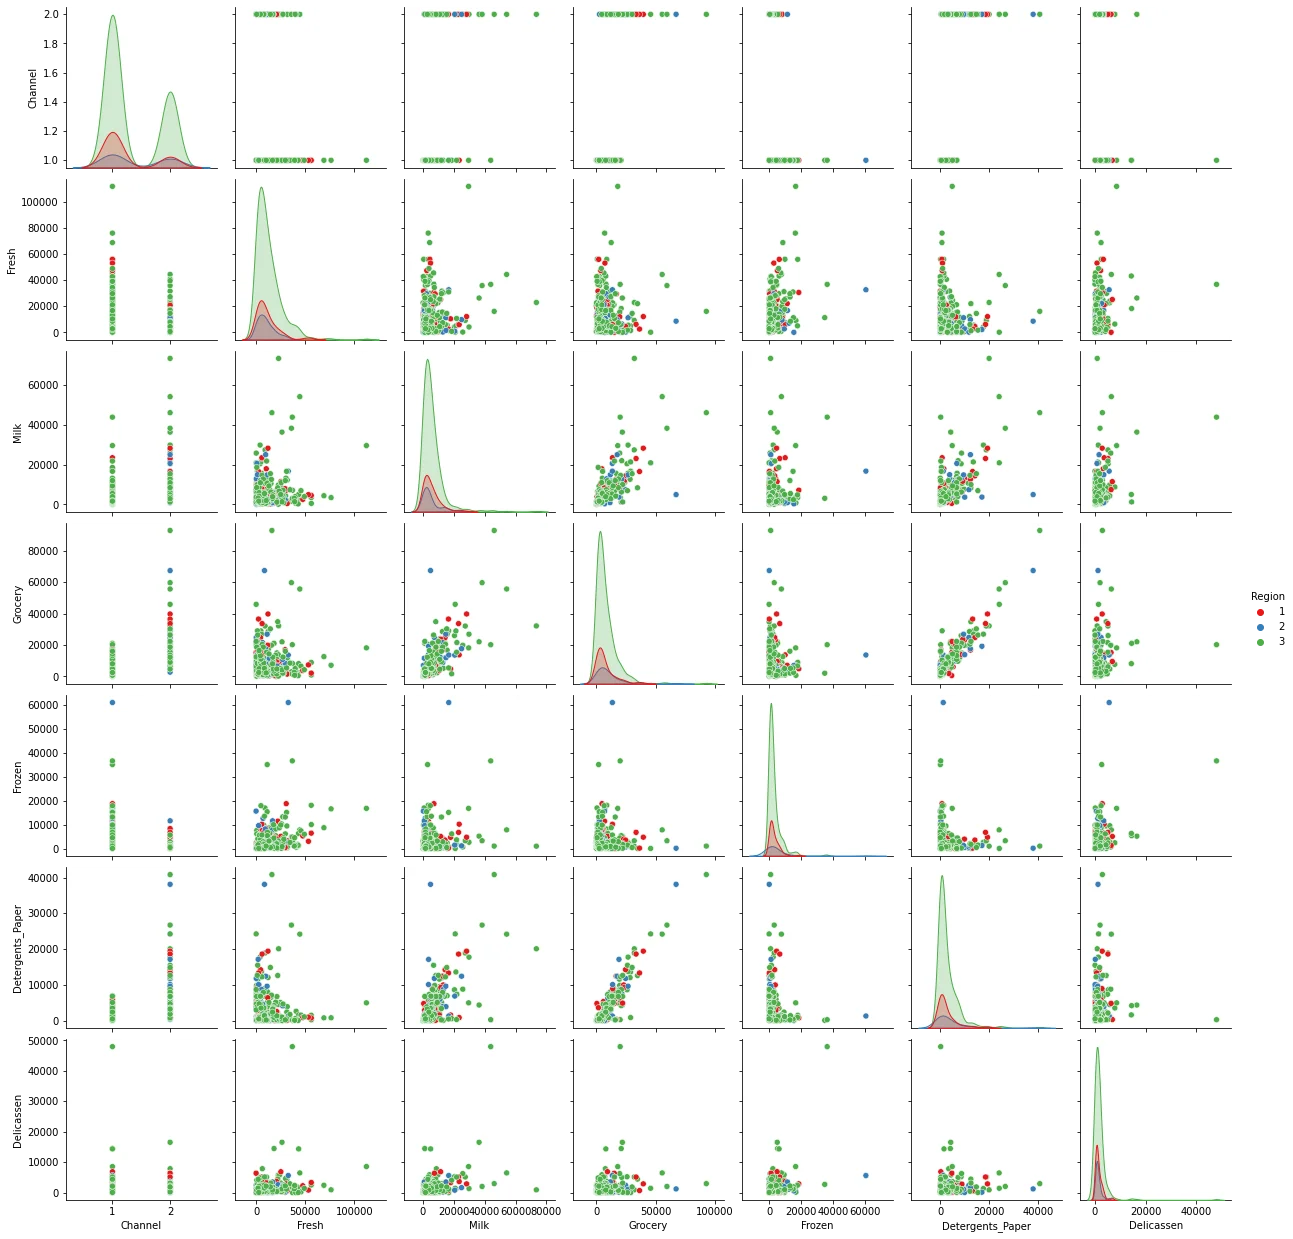
DBSCAN
TASK: Since the values of the features are in different orders of magnitude, let's scale the data. Use StandardScaler to scale the data.
#CODE HEREfrom sklearn.preprocessing import StandardScaler
scaler = StandardScaler()
scaled_X = scaler.fit_transform(df)scaled_Xarray([[ 1.44865163, 0.59066829, 0.05293319, ..., -0.58936716,
-0.04356873, -0.06633906],
[ 1.44865163, 0.59066829, -0.39130197, ..., -0.27013618,
0.08640684, 0.08915105],
[ 1.44865163, 0.59066829, -0.44702926, ..., -0.13753572,8 more lines
         0.13323164,  2.24329255],
       ...,
       [ 1.44865163,  0.59066829,  0.20032554, ..., -0.54337975,
         2.51121768,  0.12145607],
       [-0.69029709,  0.59066829, -0.13538389, ..., -0.41944059,
        -0.56977032,  0.21304614],
       [-0.69029709,  0.59066829, -0.72930698, ..., -0.62009417,
        -0.50488752, -0.52286938]])
TASK: Use DBSCAN and a for loop to create a variety of models testing different epsilon values. Set min_samples equal to 2 times the number of features. During the loop, keep track of and log the percentage of points that are outliers. For reference the solutions notebooks uses the following range of epsilon values for testing:
np.linspace(0.001,3,50)
#CODE HEREfrom sklearn.cluster import DBSCANoutlier_percent = []
for eps in np.linspace(0.001,3,50):
# Create Model
dbscan = DBSCAN(eps=eps,min_samples=2*scaled_X.shape[1])
dbscan.fit(scaled_X)
# Log percentage of points that are outliers
perc_outliers = 100 * np.sum(dbscan.labels_ == -1) / len(dbscan.labels_)
outlier_percent.append(perc_outliers)TASK: Create a line plot of the percentage of outlier points versus the epsilon value choice.
#CODE HEREsns.lineplot(x=np.linspace(0.001,3,50),y=outlier_percent)
plt.ylabel("Percentage of Points Classified as Outliers")
plt.xlabel("Epsilon Value")Text(0.5, 0, 'Epsilon Value')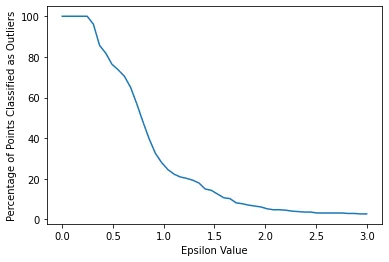
DBSCAN with Chosen Epsilon
TASK: Based on the plot created in the previous task, retrain a DBSCAN model with a reasonable epsilon value. Note: For reference, the solutions use eps=2.
dbscan = DBSCAN(eps=2)
dbscan.fit(scaled_X)DBSCAN(eps=2)TASK: Create a scatterplot of Milk vs Grocery, colored by the discovered labels of the DBSCAN model.
#CODE HEREsns.scatterplot(data=df,x='Grocery',y='Milk',hue=dbscan.labels_)<AxesSubplot:xlabel='Grocery', ylabel='Milk'>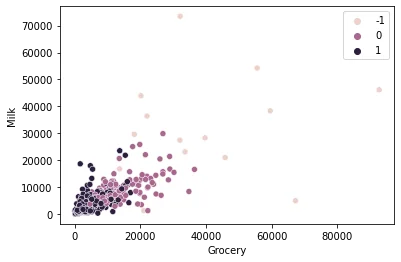
TASK: Create a scatterplot of Milk vs. Detergents Paper colored by the labels.
#CODE HEREsns.scatterplot(data=df,x='Detergents_Paper',y='Milk',hue=dbscan.labels_)<AxesSubplot:xlabel='Detergents_Paper', ylabel='Milk'>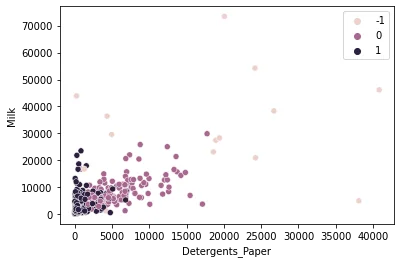
TASK: Create a new column on the original dataframe called "Labels" consisting of the DBSCAN labels.
#CODE HEREdf['Labels'] = dbscan.labels_df.head()Channel
Region
Fresh
Milk
Grocery54 more lines
Frozen
Detergents_Paper
Delicassen
Labels
0
2
3
12669
9656
7561
214
2674
1338
0
1
2
3
7057
9810
9568
1762
3293
1776
0
2
2
3
6353
8808
7684
2405
3516
7844
0
3
1
3
13265
1196
4221
6404
507
1788
1
4
2
3
22615
5410
7198
3915
1777
5185
0
TASK: Compare the statistical mean of the clusters and outliers for the spending amounts on the categories.
# CODE HEREcats = df.drop(['Channel','Region'],axis=1)
cat_means = cats.groupby('Labels').mean()cat_meansFresh
Milk
Grocery
Frozen
Detergents_Paper23 more lines
Delicassen
Labels
-1
30161.529412
26872.411765
33575.823529
12380.235294
14612.294118
8185.411765
0
8200.681818
8849.446970
13919.113636
1527.174242
6037.280303
1548.310606
1
12662.869416
3180.065292
3747.250859
3228.862543
764.697595
1125.134021
TASK: Normalize the dataframe from the previous task using MinMaxScaler so the spending means go from 0-1 and create a heatmap of the values.
#CODE HEREfrom sklearn.preprocessing import MinMaxScalerscaler = MinMaxScaler()
data = scaler.fit_transform(cat_means)
scaled_means = pd.DataFrame(data,cat_means.index,cat_means.columns)scaled_meansFresh
Milk
Grocery
Frozen
Detergents_Paper23 more lines
Delicassen
Labels
-1
1.000000
1.000000
1.000000
1.000000
1.000000
1.000000
0
0.000000
0.239292
0.341011
0.000000
0.380758
0.059938
1
0.203188
0.000000
0.000000
0.156793
0.000000
0.000000sns.heatmap(scaled_means)<AxesSubplot:ylabel='Labels'>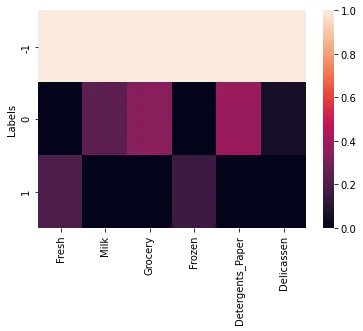
TASK: Create another heatmap similar to the one above, but with the outliers removed
sns.heatmap(scaled_means.loc[[0,1]],annot=True)<AxesSubplot:ylabel='Labels'>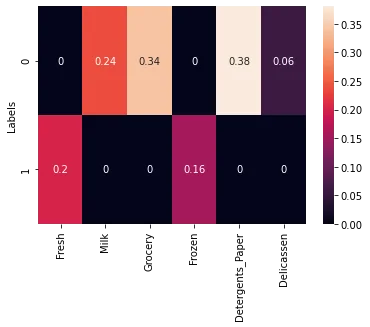
TASK: What spending category were the two clusters mode different in?
#CODE HEREWe can see that Detergents Paper was the most significant difference.