CIA Country Analysis and Clustering
Source: All these data sets are made up of data from the US government. https://www.cia.gov/library/publications/the-world-factbook/docs/faqs.html
Goal:
Gain insights into similarity between countries and regions of the world by experimenting with different cluster amounts. What do these clusters represent? Note: There is no 100% right answer, make sure to watch the video for thoughts.
Imports and Data
TASK: Run the following cells to import libraries and read in data.
df = pd.read_csv('../DATA/CIA_Country_Facts.csv')Exploratory Data Analysis
TASK: Explore the rows and columns of the data as well as the data types of the columns.
# CODE HEREdf.head()Country
Region
Population
Area (sq. mi.)
Pop. Density (per sq. mi.)120 more lines
Coastline (coast/area ratio)
Net migration
Infant mortality (per 1000 births)
GDP ($ per capita)
Literacy (%)
Phones (per 1000)
Arable (%)
Crops (%)
Other (%)
Climate
Birthrate
Deathrate
Agriculture
Industry
Service
0
Afghanistan
ASIA (EX. NEAR EAST)
31056997
647500
48.0
0.00
23.06
163.07
700.0
36.0
3.2
12.13
0.22
87.65
1.0
46.60
20.34
0.380
0.240
0.380
1
Albania
EASTERN EUROPE
3581655
28748
124.6
1.26
-4.93
21.52
4500.0
86.5
71.2
21.09
4.42
74.49
3.0
15.11
5.22
0.232
0.188
0.579
2
Algeria
NORTHERN AFRICA
32930091
2381740
13.8
0.04
-0.39
31.00
6000.0
70.0
78.1
3.22
0.25
96.53
1.0
17.14
4.61
0.101
0.600
0.298
3
American Samoa
OCEANIA
57794
199
290.4
58.29
-20.71
9.27
8000.0
97.0
259.5
10.00
15.00
75.00
2.0
22.46
3.27
NaN
NaN
NaN
4
Andorra
WESTERN EUROPE
71201
468
152.1
0.00
6.60
4.05
19000.0
100.0
497.2
2.22
0.00
97.78
3.0
8.71
6.25
NaN
NaN
NaNdf.info()<class 'pandas.core.frame.DataFrame'>
RangeIndex: 227 entries, 0 to 226
Data columns (total 20 columns):
# Column Non-Null Count Dtype
--- ------ -------------- ----- 22 more lines
 0   Country                             227 non-null    object
 1   Region                              227 non-null    object
 2   Population                          227 non-null    int64
 3   Area (sq. mi.)                      227 non-null    int64
 4   Pop. Density (per sq. mi.)          227 non-null    float64
 5   Coastline (coast/area ratio)        227 non-null    float64
 6   Net migration                       224 non-null    float64
 7   Infant mortality (per 1000 births)  224 non-null    float64
 8   GDP ($ per capita)                  226 non-null    float64
 9   Literacy (%)                        209 non-null    float64
 10  Phones (per 1000)                   223 non-null    float64
 11  Arable (%)                          225 non-null    float64
 12  Crops (%)                           225 non-null    float64
 13  Other (%)                           225 non-null    float64
 14  Climate                             205 non-null    float64
 15  Birthrate                           224 non-null    float64
 16  Deathrate                           223 non-null    float64
 17  Agriculture                         212 non-null    float64
 18  Industry                            211 non-null    float64
 19  Service                             212 non-null    float64
dtypes: float64(16), int64(2), object(2)
memory usage: 35.6+ KBdf.describe().transpose()count
mean
std
min
25%165 more lines
50%
75%
max
Population
227.0
2.874028e+07
1.178913e+08
7026.000
437624.00000
4786994.000
1.749777e+07
1.313974e+09
Area (sq. mi.)
227.0
5.982270e+05
1.790282e+06
2.000
4647.50000
86600.000
4.418110e+05
1.707520e+07
Pop. Density (per sq. mi.)
227.0
3.790471e+02
1.660186e+03
0.000
29.15000
78.800
1.901500e+02
1.627150e+04
Coastline (coast/area ratio)
227.0
2.116533e+01
7.228686e+01
0.000
0.10000
0.730
1.034500e+01
8.706600e+02
Net migration
224.0
3.812500e-02
4.889269e+00
-20.990
-0.92750
0.000
9.975000e-01
2.306000e+01
Infant mortality (per 1000 births)
224.0
3.550696e+01
3.538990e+01
2.290
8.15000
21.000
5.570500e+01
1.911900e+02
GDP ($ per capita)
226.0
9.689823e+03
1.004914e+04
500.000
1900.00000
5550.000
1.570000e+04
5.510000e+04
Literacy (%)
209.0
8.283828e+01
1.972217e+01
17.600
70.60000
92.500
9.800000e+01
1.000000e+02
Phones (per 1000)
223.0
2.360614e+02
2.279918e+02
0.200
37.80000
176.200
3.896500e+02
1.035600e+03
Arable (%)
225.0
1.379711e+01
1.304040e+01
0.000
3.22000
10.420
2.000000e+01
6.211000e+01
Crops (%)
225.0
4.564222e+00
8.361470e+00
0.000
0.19000
1.030
4.440000e+00
5.068000e+01
Other (%)
225.0
8.163831e+01
1.614083e+01
33.330
71.65000
85.700
9.544000e+01
1.000000e+02
Climate
205.0
2.139024e+00
6.993968e-01
1.000
2.00000
2.000
3.000000e+00
4.000000e+00
Birthrate
224.0
2.211473e+01
1.117672e+01
7.290
12.67250
18.790
2.982000e+01
5.073000e+01
Deathrate
223.0
9.241345e+00
4.990026e+00
2.290
5.91000
7.840
1.060500e+01
2.974000e+01
Agriculture
212.0
1.508443e-01
1.467980e-01
0.000
0.03775
0.099
2.210000e-01
7.690000e-01
Industry
211.0
2.827109e-01
1.382722e-01
0.020
0.19300
0.272
3.410000e-01
9.060000e-01
Service
212.0
5.652830e-01
1.658410e-01
0.062
0.42925
0.571
6.785000e-01
9.540000e-01
Exploratory Data Analysis
Let's create some visualizations. Please feel free to expand on these with your own analysis and charts!
TASK: Create a histogram of the Population column.
# CODE HEREsns.histplot(data=df,x='Population')<AxesSubplot:xlabel='Population', ylabel='Count'>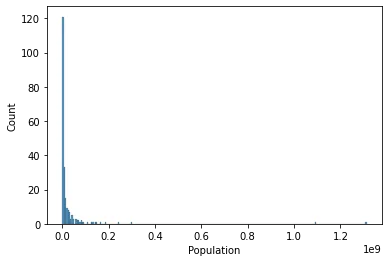
TASK: You should notice the histogram is skewed due to a few large countries, reset the X axis to only show countries with less than 0.5 billion people
#CODE HEREsns.histplot(data=df[df['Population']<500000000],x='Population')<AxesSubplot:xlabel='Population', ylabel='Count'>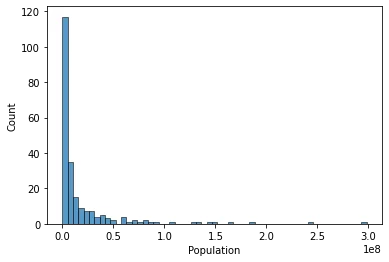
TASK: Now let's explore GDP and Regions. Create a bar chart showing the mean GDP per Capita per region (recall the black bar represents std).
# CODE HEREplt.figure(figsize=(10,6),dpi=200)
sns.barplot(data=df,y='GDP ($ per capita)',x='Region',estimator=np.mean)
plt.xticks(rotation=90);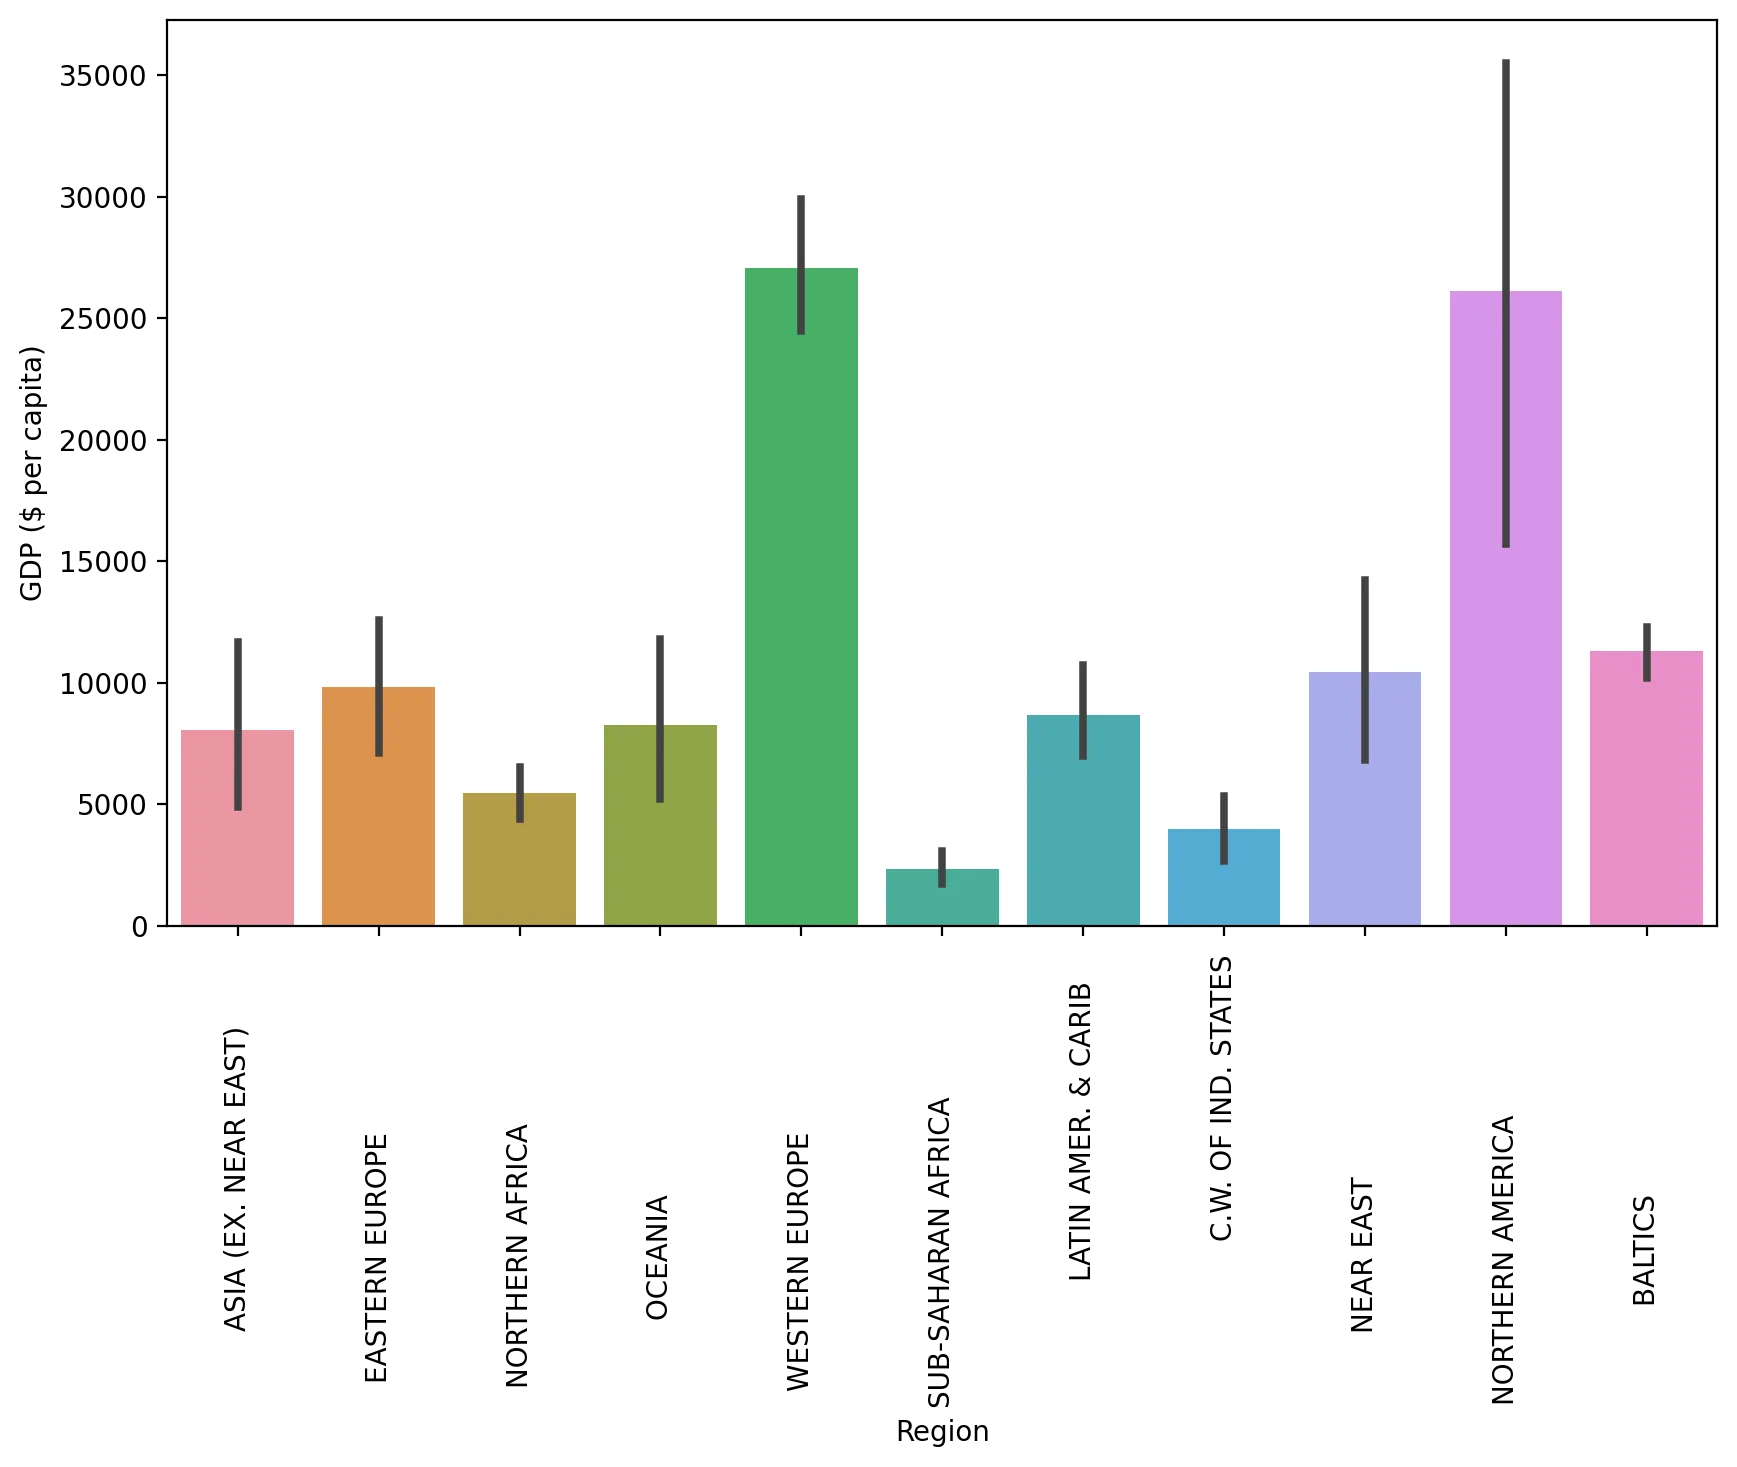
TASK: Create a scatterplot showing the relationship between Phones per 1000 people and the GDP per Capita. Color these points by Region.
#CODE HEREplt.figure(figsize=(10,6),dpi=200)
sns.scatterplot(data=df,x='GDP ($ per capita)',y='Phones (per 1000)',hue='Region')
plt.legend(loc=(1.05,0.5))<matplotlib.legend.Legend at 0x194e5896160>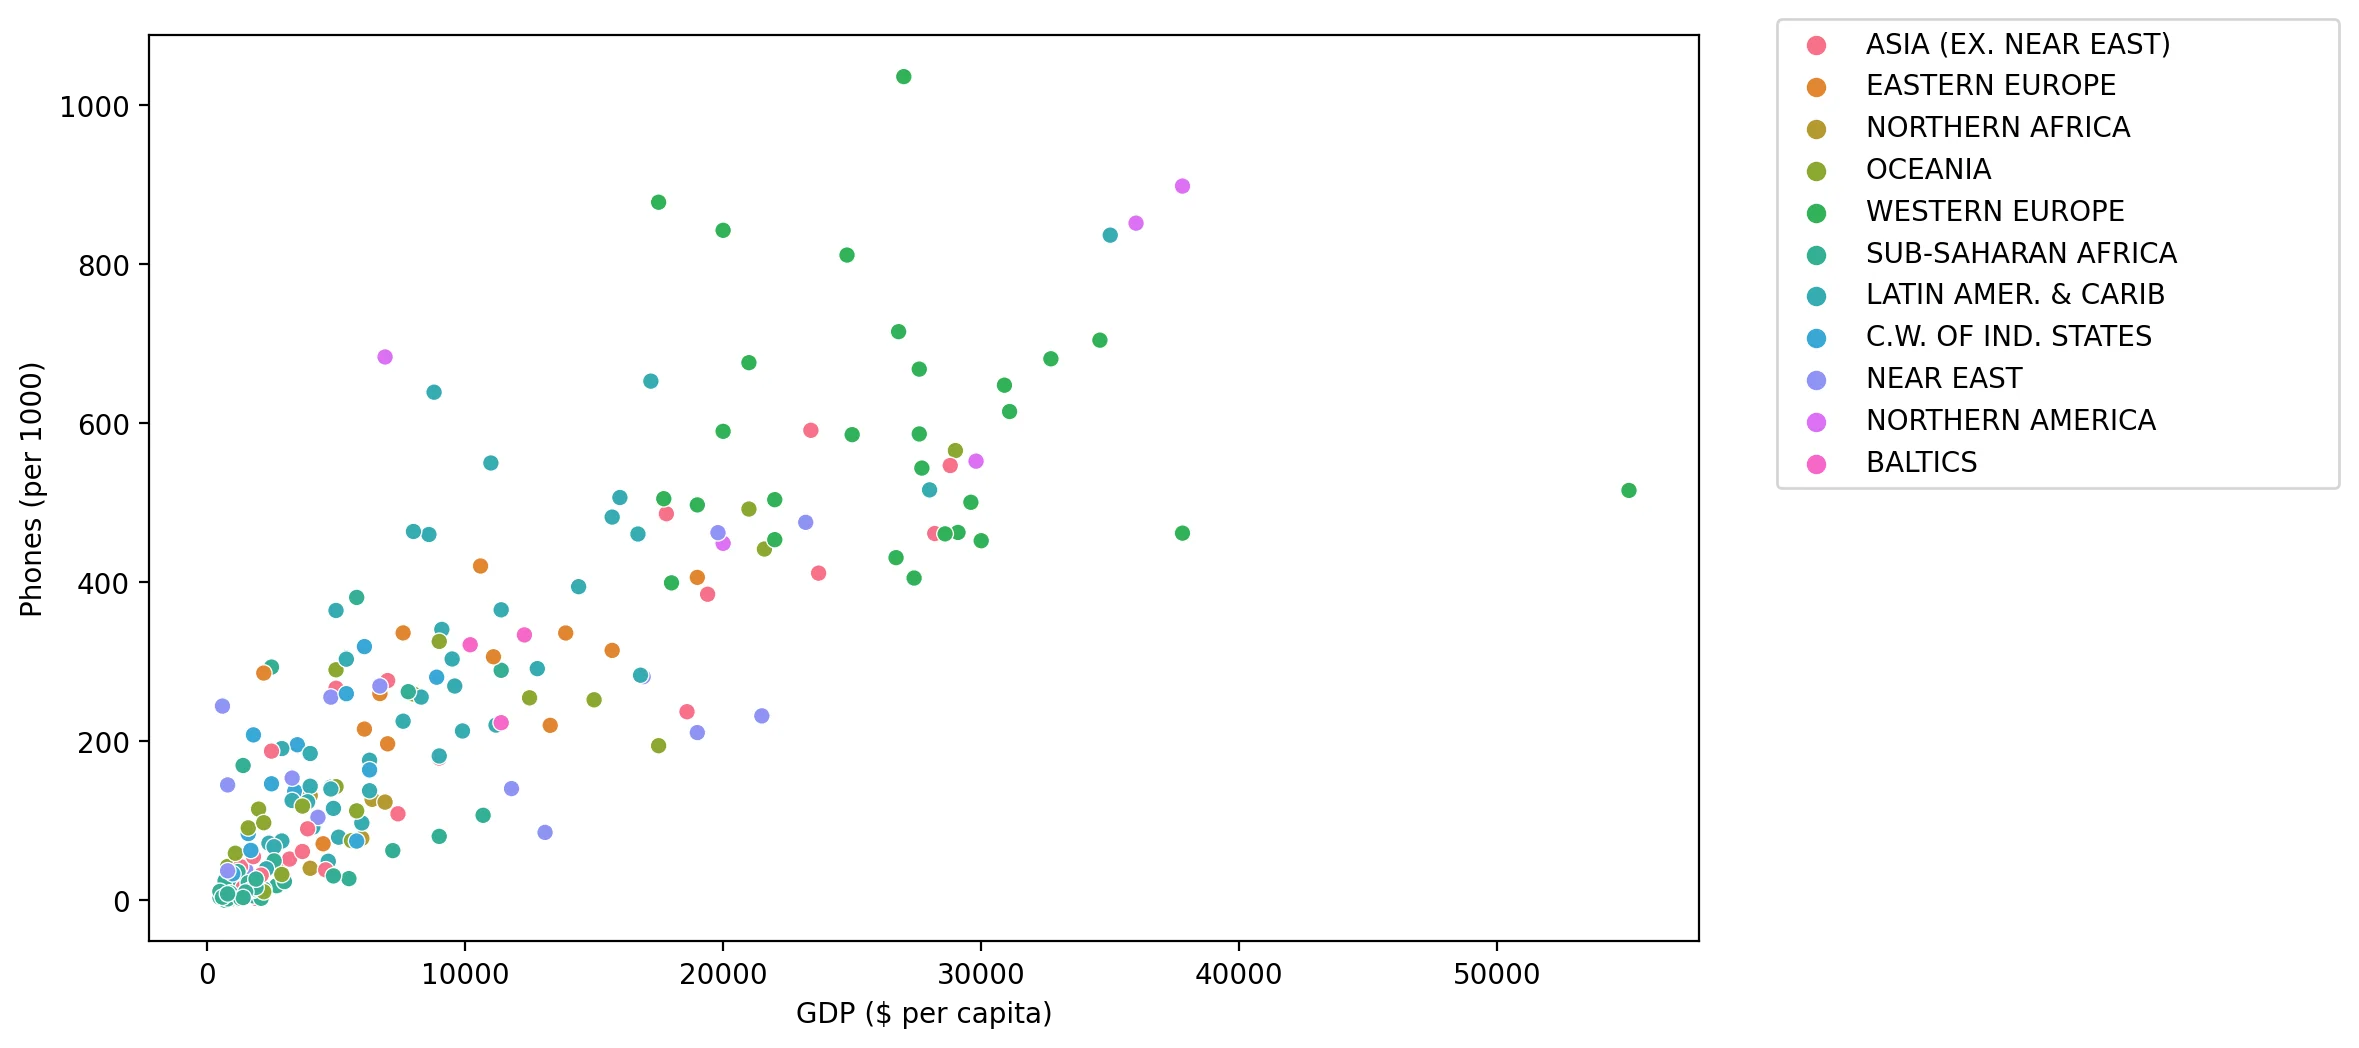
TASK: Create a scatterplot showing the relationship between GDP per Capita and Literacy (color the points by Region). What conclusions do you draw from this plot?
#CODE HEREplt.figure(figsize=(10,6),dpi=200)
sns.scatterplot(data=df,x='GDP ($ per capita)',y='Literacy (%)',hue='Region')<AxesSubplot:xlabel='GDP ($ per capita)', ylabel='Literacy (%)'>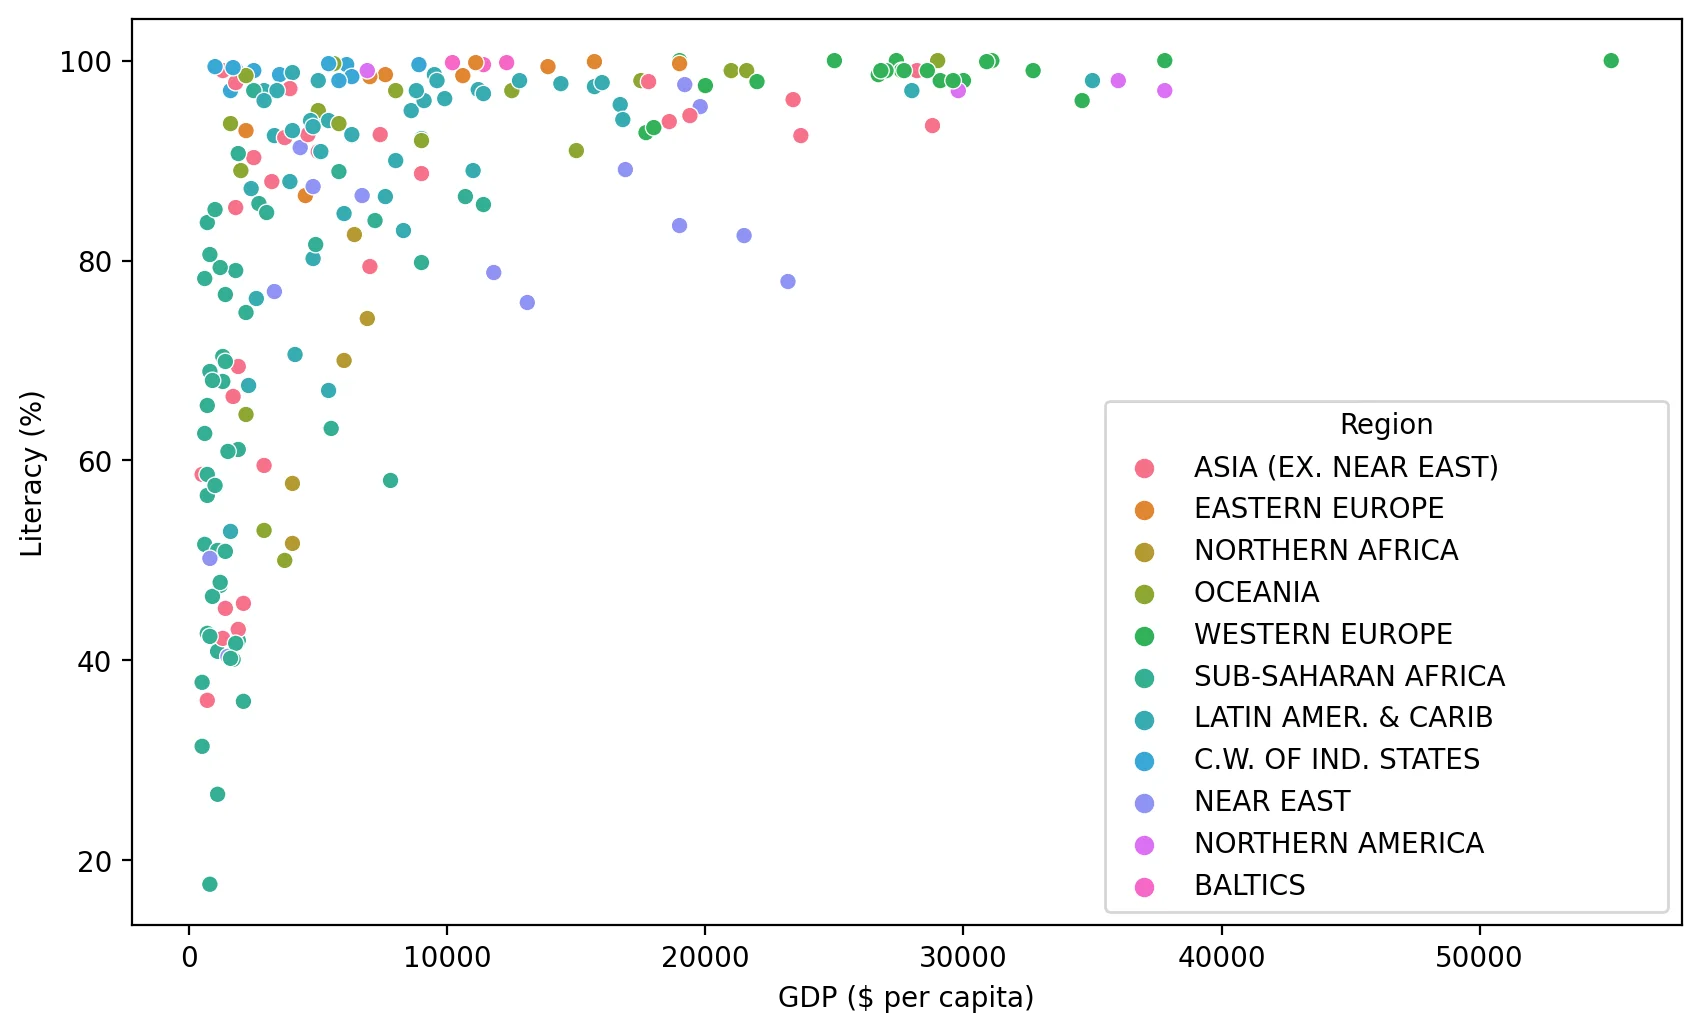
TASK: Create a Heatmap of the Correlation between columns in the DataFrame.
#CODE HEREsns.heatmap(df.corr())<AxesSubplot:>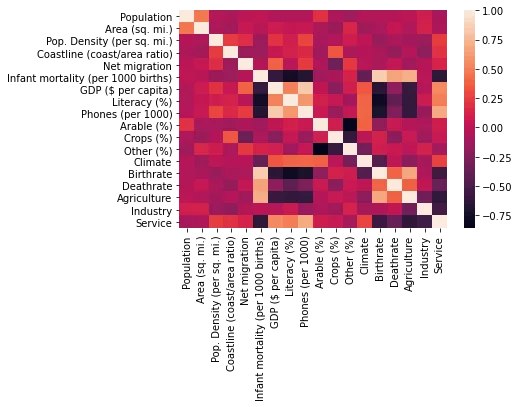
TASK: Seaborn can auto perform hierarchal clustering through the clustermap() function. Create a clustermap of the correlations between each column with this function.
# CODE HEREsns.clustermap(df.corr())<seaborn.matrix.ClusterGrid at 0x194e3dc53d0>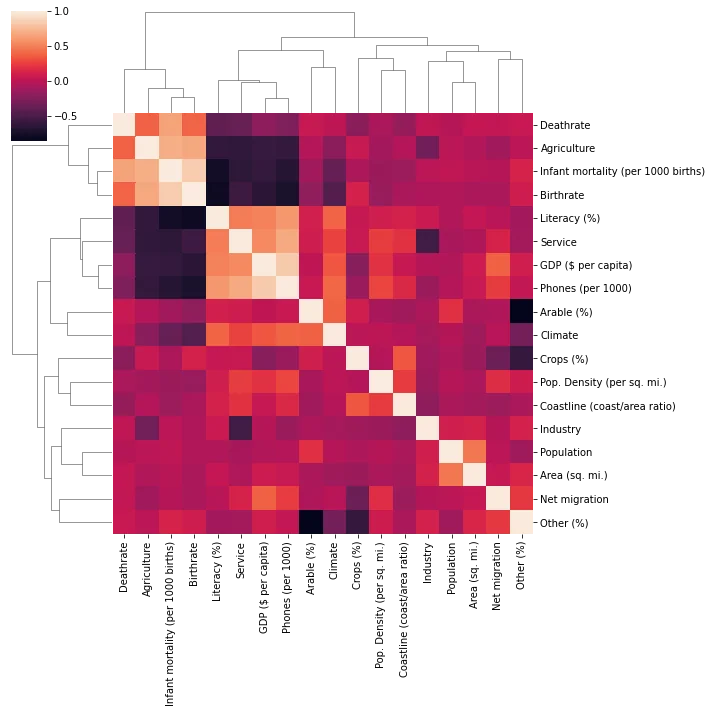
Data Preparation and Model Discovery
Let's now prepare our data for Kmeans Clustering!
Missing Data
TASK: Report the number of missing elements per column.
#CODE HEREdf.isnull().sum()Country 0
Region 0
Population 0
Area (sq. mi.) 0
Pop. Density (per sq. mi.) 016 more lines
Coastline (coast/area ratio)           0
Net migration                          3
Infant mortality (per 1000 births)     3
GDP ($ per capita)                     1
Literacy (%)                          18
Phones (per 1000)                      4
Arable (%)                             2
Crops (%)                              2
Other (%)                              2
Climate                               22
Birthrate                              3
Deathrate                              4
Agriculture                           15
Industry                              16
Service                               15
dtype: int64
TASK: What countries have NaN for Agriculture? What is the main aspect of these countries?
df[df['Agriculture'].isnull()]['Country']3 American Samoa
4 Andorra
78 Gibraltar
80 Greenland
83 Guam11 more lines
134                 Mayotte
140              Montserrat
144                   Nauru
153      N. Mariana Islands
171            Saint Helena
174    St Pierre & Miquelon
177              San Marino
208       Turks & Caicos Is
221       Wallis and Futuna
223          Western Sahara
Name: Country, dtype: object
TASK: You should have noticed most of these countries are tiny islands, with the exception of Greenland and Western Sahara. Go ahead and fill any of these countries missing NaN values with 0, since they are so small or essentially non-existant. There should be 15 countries in total you do this for. For a hint on how to do this, recall you can do the following:
df[df['feature'].isnull()]
# REMOVAL OF TINY ISLANDS
df[df['Agriculture'].isnull()] = df[df['Agriculture'].isnull()].fillna(0)
TASK: Now check to see what is still missing by counting number of missing elements again per feature:
#CODE HEREdf.isnull().sum()Country 0
Region 0
Population 0
Area (sq. mi.) 0
Pop. Density (per sq. mi.) 016 more lines
Coastline (coast/area ratio)           0
Net migration                          1
Infant mortality (per 1000 births)     1
GDP ($ per capita)                     0
Literacy (%)                          13
Phones (per 1000)                      2
Arable (%)                             1
Crops (%)                              1
Other (%)                              1
Climate                               18
Birthrate                              1
Deathrate                              2
Agriculture                            0
Industry                               1
Service                                1
dtype: int64
TASK: Notice climate is missing for a few countries, but not the Region! Let's use this to our advantage. Fill in the missing Climate values based on the mean climate value for its region.
Hints on how to do this: https://stackoverflow.com/questions/19966018/pandas-filling-missing-values-by-mean-in-each-group
# CODE HERE# https://stackoverflow.com/questions/19966018/pandas-filling-missing-values-by-mean-in-each-group
df['Climate'] = df['Climate'].fillna(df.groupby('Region')['Climate'].transform('mean'))TASK: Check again on many elements are missing:
#CODE HEREdf.isnull().sum()Country 0
Region 0
Population 0
Area (sq. mi.) 0
Pop. Density (per sq. mi.) 016 more lines
Coastline (coast/area ratio)           0
Net migration                          1
Infant mortality (per 1000 births)     1
GDP ($ per capita)                     0
Literacy (%)                          13
Phones (per 1000)                      2
Arable (%)                             1
Crops (%)                              1
Other (%)                              1
Climate                                0
Birthrate                              1
Deathrate                              2
Agriculture                            0
Industry                               1
Service                                1
dtype: int64
TASK: It looks like Literacy percentage is missing. Use the same tactic as we did with Climate missing values and fill in any missing Literacy % values with the mean Literacy % of the Region.
#CODE HEREdf[df['Literacy (%)'].isnull()]Country
Region
Population
Area (sq. mi.)
Pop. Density (per sq. mi.)288 more lines
Coastline (coast/area ratio)
Net migration
Infant mortality (per 1000 births)
GDP ($ per capita)
Literacy (%)
Phones (per 1000)
Arable (%)
Crops (%)
Other (%)
Climate
Birthrate
Deathrate
Agriculture
Industry
Service
25
Bosnia & Herzegovina
EASTERN EUROPE
4498976
51129
88.0
0.04
0.31
21.05
6100.0
NaN
215.4
13.60
2.96
83.44
4.000000
8.77
8.27
0.142
0.308
0.550
66
Faroe Islands
WESTERN EUROPE
47246
1399
33.8
79.84
1.41
6.24
22000.0
NaN
503.8
2.14
0.00
97.86
2.826087
14.05
8.70
0.270
0.110
0.620
74
Gaza Strip
NEAR EAST
1428757
360
3968.8
11.11
1.60
22.93
600.0
NaN
244.3
28.95
21.05
50.00
3.000000
39.45
3.80
0.030
0.283
0.687
85
Guernsey
WESTERN EUROPE
65409
78
838.6
64.10
3.84
4.71
20000.0
NaN
842.4
NaN
NaN
NaN
3.000000
8.81
10.01
0.030
0.100
0.870
99
Isle of Man
WESTERN EUROPE
75441
572
131.9
27.97
5.36
5.93
21000.0
NaN
676.0
9.00
0.00
91.00
3.000000
11.05
11.19
0.010
0.130
0.860
104
Jersey
WESTERN EUROPE
91084
116
785.2
60.34
2.76
5.24
24800.0
NaN
811.3
0.00
0.00
100.00
3.000000
9.30
9.28
0.050
0.020
0.930
108
Kiribati
OCEANIA
105432
811
130.0
140.94
0.00
48.52
800.0
NaN
42.7
2.74
50.68
46.58
2.000000
30.65
8.26
0.089
0.242
0.668
123
Macedonia
EASTERN EUROPE
2050554
25333
80.9
0.00
-1.45
10.09
6700.0
NaN
260.0
22.26
1.81
75.93
3.000000
12.02
8.77
0.118
0.319
0.563
185
Slovakia
EASTERN EUROPE
5439448
48845
111.4
0.00
0.30
7.41
13300.0
NaN
220.1
30.16
2.62
67.22
3.000000
10.65
9.45
0.035
0.294
0.672
187
Solomon Islands
OCEANIA
552438
28450
19.4
18.67
0.00
21.29
1700.0
NaN
13.4
0.64
2.00
97.36
2.000000
30.01
3.92
0.420
0.110
0.470
209
Tuvalu
OCEANIA
11810
26
454.2
92.31
0.00
20.03
1100.0
NaN
59.3
0.00
0.00
100.00
2.000000
22.18
7.11
0.166
0.272
0.562
220
Virgin Islands
LATIN AMER. & CARIB
108605
1910
56.9
9.84
-8.94
8.03
17200.0
NaN
652.8
11.76
2.94
85.30
2.000000
13.96
6.43
0.010
0.190
0.800
222
West Bank
NEAR EAST
2460492
5860
419.9
0.00
2.98
19.62
800.0
NaN
145.2
16.90
18.97
64.13
3.000000
31.67
3.92
0.090
0.280
0.630# https://stackoverflow.com/questions/19966018/pandas-filling-missing-values-by-mean-in-each-group
df['Literacy (%)'] = df['Literacy (%)'].fillna(df.groupby('Region')['Literacy (%)'].transform('mean'))TASK: Check again on the remaining missing values:
df.isnull().sum()Country 0
Region 0
Population 0
Area (sq. mi.) 0
Pop. Density (per sq. mi.) 016 more lines
Coastline (coast/area ratio)          0
Net migration                         1
Infant mortality (per 1000 births)    1
GDP ($ per capita)                    0
Literacy (%)                          0
Phones (per 1000)                     2
Arable (%)                            1
Crops (%)                             1
Other (%)                             1
Climate                               0
Birthrate                             1
Deathrate                             2
Agriculture                           0
Industry                              1
Service                               1
dtype: int64
TASK: Optional: We are now missing values for only a few countries. Go ahead and drop these countries OR feel free to fill in these last few remaining values with any preferred methodology. For simplicity, we will drop these.
# CODE HEREdf = df.dropna()Data Feature Preparation
TASK: It is now time to prepare the data for clustering. The Country column is still a unique identifier string, so it won't be useful for clustering, since its unique for each point. Go ahead and drop this Country column.
#CODE HEREX = df.drop("Country",axis=1)TASK: Now let's create the X array of features, the Region column is still categorical strings, use Pandas to create dummy variables from this column to create a finalzed X matrix of continuous features along with the dummy variables for the Regions.
#COde hereX = pd.get_dummies(X)X.head()Population
Area (sq. mi.)
Pop. Density (per sq. mi.)
Coastline (coast/area ratio)
Net migration127 more lines
Infant mortality (per 1000 births)
GDP ($ per capita)
Literacy (%)
Phones (per 1000)
Arable (%)
...
Region_BALTICS
Region_C.W. OF IND. STATES
Region_EASTERN EUROPE
Region_LATIN AMER. & CARIB
Region_NEAR EAST
Region_NORTHERN AFRICA
Region_NORTHERN AMERICA
Region_OCEANIA
Region_SUB-SAHARAN AFRICA
Region_WESTERN EUROPE
0
31056997
647500
48.0
0.00
23.06
163.07
700.0
36.0
3.2
12.13
...
0
0
0
0
0
0
0
0
0
0
1
3581655
28748
124.6
1.26
-4.93
21.52
4500.0
86.5
71.2
21.09
...
0
0
1
0
0
0
0
0
0
0
2
32930091
2381740
13.8
0.04
-0.39
31.00
6000.0
70.0
78.1
3.22
...
0
0
0
0
0
1
0
0
0
0
3
57794
199
290.4
58.29
-20.71
9.27
8000.0
97.0
259.5
10.00
...
0
0
0
0
0
0
0
1
0
0
4
71201
468
152.1
0.00
6.60
4.05
19000.0
100.0
497.2
2.22
...
0
0
0
0
0
0
0
0
0
1
5 rows × 29 columns
Scaling
TASK: Due to some measurements being in terms of percentages and other metrics being total counts (population), we should scale this data first. Use Sklearn to scale the X feature matrics.
#CODE HEREfrom sklearn.preprocessing import StandardScalerscaler = StandardScaler()
scaled_X = scaler.fit_transform(X)scaled_Xarray([[ 0.0133285 , 0.01855412, -0.20308668, ..., -0.31544015,
-0.54772256, -0.36514837],
[-0.21730118, -0.32370888, -0.14378531, ..., -0.31544015,
-0.54772256, -0.36514837],
[ 0.02905136, 0.97784988, -0.22956327, ..., -0.31544015,8 more lines
        -0.54772256, -0.36514837],
       ...,
       [-0.06726127, -0.04756396, -0.20881553, ..., -0.31544015,
        -0.54772256, -0.36514837],
       [-0.15081724,  0.07669798, -0.22840201, ..., -0.31544015,
         1.82574186, -0.36514837],
       [-0.14464933, -0.12356132, -0.2160153 , ..., -0.31544015,
         1.82574186, -0.36514837]])
Creating and Fitting Kmeans Model
TASK: Use a for loop to create and fit multiple KMeans models, testing from K=2-30 clusters. Keep track of the Sum of Squared Distances for each K value, then plot this out to create an "elbow" plot of K versus SSD. Optional: You may also want to create a bar plot showing the SSD difference from the previous cluster.
#CODE HEREfrom sklearn.cluster import KMeansssd = []
for k in range(2,30):
model = KMeans(n_clusters=k)
model.fit(scaled_X)
#Sum of squared distances of samples to their closest cluster center.
ssd.append(model.inertia_)plt.plot(range(2,30),ssd,'o--')
plt.xlabel("K Value")
plt.ylabel(" Sum of Squared Distances")Text(0, 0.5, ' Sum of Squared Distances')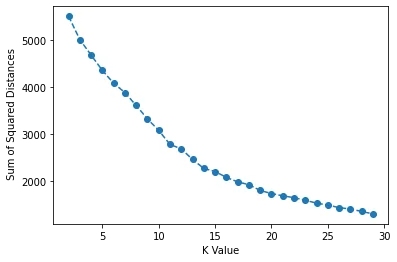
pd.Series(ssd).diff().plot(kind='bar')<AxesSubplot:>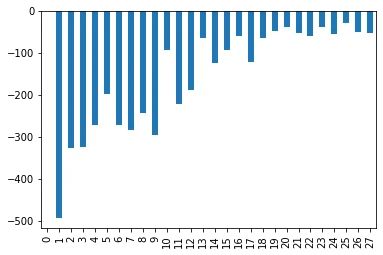
Model Interpretation
TASK: What K value do you think is a good choice? Are there multiple reasonable choices? What features are helping define these cluster choices. As this is unsupervised learning, there is no 100% correct answer here. Please feel free to jump to the solutions for a full discussion on this!.
# Nothing to really code here, but choose a K value and see what features
# are most correlated to belonging to a particular cluster!

# Remember, there is no 100% correct answer here!
Example Interpretation: Choosing K=3
One could say that there is a significant drop off in SSD difference at K=3 (although we can see it continues to drop off past this). What would an analysis look like for K=3? Let's explore which features are important in the decision of 3 clusters!
model = KMeans(n_clusters=3)
model.fit(scaled_X)KMeans(n_clusters=3)model.labels_array([2, 0, 0, 0, 1, 2, 0, 0, 0, 0, 1, 1, 1, 0, 0, 0, 2, 1, 1, 1, 0, 2,
1, 2, 0, 1, 2, 0, 1, 0, 1, 2, 2, 2, 2, 2, 1, 0, 1, 2, 2, 0, 0, 0,
2, 2, 2, 0, 2, 1, 0, 1, 1, 2, 0, 0, 0, 0, 0, 2, 2, 1, 2, 1, 0, 1,
1, 0, 0, 2, 2, 0, 0, 1, 2, 1, 1, 0, 0, 0, 0, 0, 2, 2, 0, 2, 0, 1,
1, 1, 0, 0, 0, 0, 1, 1, 1, 1, 0, 1, 1, 0, 0, 2, 0, 0, 1, 0, 0, 2,6 more lines
       1, 0, 2, 2, 0, 1, 1, 1, 1, 1, 2, 2, 0, 0, 2, 1, 0, 0, 2, 0, 2, 0,
       0, 0, 0, 0, 0, 2, 2, 0, 2, 1, 0, 0, 1, 0, 2, 2, 0, 1, 0, 2, 0, 0,
       0, 0, 0, 0, 1, 1, 0, 0, 0, 1, 0, 2, 0, 0, 0, 0, 0, 0, 1, 0, 0, 2,
       0, 2, 1, 1, 1, 0, 2, 2, 1, 0, 2, 0, 2, 1, 1, 0, 1, 0, 2, 0, 2, 0,
       0, 0, 0, 0, 0, 0, 2, 0, 0, 1, 1, 0, 0, 0, 0, 0, 0, 0, 0, 0, 2, 2,
2])X['K=3 Clusters'] = model.labels_X.corr()['K=3 Clusters'].sort_values()Literacy (%) -0.419453
Region_LATIN AMER. & CARIB -0.377533
Region_OCEANIA -0.248224
Crops (%) -0.245934
Phones (per 1000) -0.19873726 more lines
Region_C.W. OF IND. STATES                   -0.193384
Region_NEAR EAST                             -0.179732
Coastline (coast/area ratio)                 -0.158318
Region_NORTHERN AFRICA                       -0.151646
Service                                      -0.117898
Population                                   -0.062404
GDP ($ per capita)                           -0.060568
Industry                                     -0.048420
Area (sq. mi.)                               -0.039735
Region_NORTHERN AMERICA                      -0.027789
Pop. Density (per sq. mi.)                    0.013816
Other (%)                                     0.016429
Climate                                       0.024573
Region_ASIA (EX. NEAR EAST)                   0.028712
Region_BALTICS                                0.035283
Region_EASTERN EUROPE                         0.043691
Arable (%)                                    0.084553
Region_WESTERN EUROPE                         0.109824
Net migration                                 0.208539
Agriculture                                   0.440815
Birthrate                                     0.494413
Infant mortality (per 1000 births)            0.614130
Region_SUB-SAHARAN AFRICA                     0.670927
Deathrate                                     0.727801
K=3 Clusters                                  1.000000
Name: K=3 Clusters, dtype: float64
BONUS CHALLGENGE:
Geographical Model Interpretation
The best way to interpret this model is through visualizing the clusters of countries on a map! NOTE: THIS IS A BONUS SECTION. YOU MAY WANT TO JUMP TO THE SOLUTIONS LECTURE FOR A FULL GUIDE, SINCE WE WILL COVER TOPICS NOT PREVIOUSLY DISCUSSED AND BE HAVING A NUANCED DISCUSSION ON PERFORMANCE!
IF YOU GET STUCK, PLEASE CHECK OUT THE SOLUTIONS LECTURE. AS THIS IS OPTIONAL AND COVERS MANY TOPICS NOT SHOWN IN ANY PREVIOUS LECTURE
TASK: Create cluster labels for a chosen K value. Based on the solutions, we believe either K=3 or K=15 are reasonable choices. But feel free to choose differently and explore.
model = KMeans(n_clusters=15)

model.fit(scaled_X)KMeans(n_clusters=15)model = KMeans(n_clusters=3)
model.fit(scaled_X)KMeans(n_clusters=3)TASK: Let's put you in the real world! Your boss just asked you to plot out these clusters on a country level choropleth map, can you figure out how to do this? We won't step by step guide you at all on this, just show you an example result. You'll need to do the following:
- Figure out how to install plotly library: https://plotly.com/python/getting-started/
- Figure out how to create a geographical choropleth map using plotly: https://plotly.com/python/choropleth-maps/#using-builtin-country-and-state-geometries
- You will need ISO Codes for this. Either use the wikipedia page, or use our provided file for this: "../DATA/country_iso_codes.csv"
- Combine the cluster labels, ISO Codes, and Country Names to create a world map plot with plotly given what you learned in Step 1 and Step 2.
Note: This is meant to be a more realistic project, where you have a clear objective of what you need to create and accomplish and the necessary online documentation. It's up to you to piece everything together to figure it out! If you get stuck, no worries! Check out the solution lecture.
iso_codes = pd.read_csv("../DATA/country_iso_codes.csv")iso_codesCountry
ISO Code
0
Afghanistan
AFG31 more lines
1
Akrotiri and Dhekelia – See United Kingdom, The
Akrotiri and Dhekelia – See United Kingdom, The
2
Åland Islands
ALA
3
Albania
ALB
4
Algeria
DZA
...
...
...
296
Congo, Dem. Rep.
COD
297
Congo, Repub. of the
COG
298
Tanzania
TZA
299
Central African Rep.
CAF
300
Cote d'Ivoire
CIV
301 rows × 2 columnsiso_mapping = iso_codes.set_index('Country')['ISO Code'].to_dict()iso_mapping{'Afghanistan': 'AFG',
'Akrotiri and Dhekelia – See United Kingdom, The': 'Akrotiri and Dhekelia – See United Kingdom, The',
'Åland Islands': 'ALA',
'Albania': 'ALB',
'Algeria': 'DZA',296 more lines
 'American Samoa': 'ASM',
 'Andorra': 'AND',
 'Angola': 'AGO',
 'Anguilla': 'AIA',
 'Antarctica\u200a[a]': 'ATA',
 'Antigua and Barbuda': 'ATG',
 'Argentina': 'ARG',
 'Armenia': 'ARM',
 'Aruba': 'ABW',
 'Ashmore and Cartier Islands – See Australia.': 'Ashmore and Cartier Islands – See Australia.',
 'Australia\u200a[b]': 'AUS',
 'Austria': 'AUT',
 'Azerbaijan': 'AZE',
 'Bahamas (the)': 'BHS',
 'Bahrain': 'BHR',
 'Bangladesh': 'BGD',
 'Barbados': 'BRB',
 'Belarus': 'BLR',
 'Belgium': 'BEL',
 'Belize': 'BLZ',
 'Benin': 'BEN',
 'Bermuda': 'BMU',
 'Bhutan': 'BTN',
 'Bolivia (Plurinational State of)': 'BOL',
 'Bonaire\xa0Sint Eustatius\xa0Saba': 'BES',
 'Bosnia and Herzegovina': 'BIH',
 'Botswana': 'BWA',
 'Bouvet Island': 'BVT',
 'Brazil': 'BRA',
 'British Indian Ocean Territory (the)': 'IOT',
 'British Virgin Islands – See Virgin Islands (British).': 'British Virgin Islands – See Virgin Islands (British).',
 'Brunei Darussalam\u200a[e]': 'BRN',
 'Bulgaria': 'BGR',
 'Burkina Faso': 'BFA',
 'Burma – See Myanmar.': 'Burma – See Myanmar.',
 'Burundi': 'BDI',
 'Cabo Verde\u200a[f]': 'CPV',
 'Cambodia': 'KHM',
 'Cameroon': 'CMR',
 'Canada': 'CAN',
 'Cape Verde – See Cabo Verde.': 'Cape Verde – See Cabo Verde.',
 'Caribbean Netherlands – See Bonaire, Sint Eustatius and Saba.': 'Caribbean Netherlands – See Bonaire, Sint Eustatius and Saba.',
 'Cayman Islands (the)': 'CYM',
 'Central African Republic (the)': 'CAF',
 'Chad': 'TCD',
 'Chile': 'CHL',
 'China': 'CHN',
 'China, The Republic of – See Taiwan (Province of China).': 'China, The Republic of – See Taiwan (Province of China).',
 'Christmas Island': 'CXR',
 'Clipperton Island – See France.': 'Clipperton Island – See France.',
 'Cocos (Keeling) Islands (the)': 'CCK',
 'Colombia': 'COL',
 'Comoros (the)': 'COM',
 'Congo (the Democratic Republic of the)': 'COD',
 'Congo (the)\u200a[g]': 'COG',
 'Cook Islands (the)': 'COK',
 'Coral Sea Islands – See Australia.': 'Coral Sea Islands – See Australia.',
 'Costa Rica': 'CRI',
 "Côte d'Ivoire\u200a[h]": 'CIV',
 'Croatia': 'HRV',
 'Cuba': 'CUB',
 'Curaçao': 'CUW',
 'Cyprus': 'CYP',
 'Czechia\u200a[i]': 'CZE',
 "Democratic People's Republic of Korea – See Korea, The Democratic People's Republic of.": "Democratic People's Republic of Korea – See Korea, The Democratic People's Republic of.",
 'Democratic Republic of the Congo – See Congo, The Democratic Republic of the.': 'Democratic Republic of the Congo – See Congo, The Democratic Republic of the.',
 'Denmark': 'DNK',
 'Djibouti': 'DJI',
 'Dominica': 'DMA',
 'Dominican Republic (the)': 'DOM',
 'East Timor – See Timor-Leste.': 'East Timor – See Timor-Leste.',
 'Ecuador': 'ECU',
 'Egypt': 'EGY',
 'El Salvador': 'SLV',
 'England – See United Kingdom, The.': 'England – See United Kingdom, The.',
 'Equatorial Guinea': 'GNQ',
 'Eritrea': 'ERI',
 'Estonia': 'EST',
 'Eswatini\u200a[j]': 'SWZ',
 'Ethiopia': 'ETH',
 'Falkland Islands (the) [Malvinas]\u200a[k]': 'FLK',
 'Faroe Islands (the)': 'FRO',
 'Fiji': 'FJI',
 'Finland': 'FIN',
 'France\u200a[l]': 'FRA',
 'French Guiana': 'GUF',
 'French Polynesia': 'PYF',
 'French Southern Territories (the)\u200a[m]': 'ATF',
 'Gabon': 'GAB',
 'Gambia (the)': 'GMB',
 'Georgia': 'GEO',
 'Germany': 'DEU',
 'Ghana': 'GHA',
 'Gibraltar': 'GIB',
 'Great Britain – See United Kingdom, The.': 'Great Britain – See United Kingdom, The.',
 'Greece': 'GRC',
 'Greenland': 'GRL',
 'Grenada': 'GRD',
 'Guadeloupe': 'GLP',
 'Guam': 'GUM',
 'Guatemala': 'GTM',
 'Guernsey': 'GGY',
 'Guinea': 'GIN',
 'Guinea-Bissau': 'GNB',
 'Guyana': 'GUY',
 'Haiti': 'HTI',
 'Hawaiian Islands – See United States of America, The.': 'Hawaiian Islands – See United States of America, The.',
 'Heard Island and McDonald Islands': 'HMD',
 'Holy See (the)\u200a[n]': 'VAT',
 'Honduras': 'HND',
 'Hong Kong': 'HKG',
 'Hungary': 'HUN',
 'Iceland': 'ISL',
 'India': 'IND',
 'Indonesia': 'IDN',
 'Iran (Islamic Republic of)': 'IRN',
 'Iraq': 'IRQ',
 'Ireland': 'IRL',
 'Isle of Man': 'IMN',
 'Israel': 'ISR',
 'Italy': 'ITA',
 "Ivory Coast – See Côte d'Ivoire.": "Ivory Coast – See Côte d'Ivoire.",
 'Jamaica': 'JAM',
 'Jan Mayen – See Svalbard and Jan Mayen.': 'Jan Mayen – See Svalbard and Jan Mayen.',
 'Japan': 'JPN',
 'Jersey': 'JEY',
 'Jordan': 'JOR',
 'Kazakhstan': 'KAZ',
 'Kenya': 'KEN',
 'Kiribati': 'KIR',
 "Korea (the Democratic People's Republic of)\u200a[o]": 'PRK',
 'Korea (the Republic of)\u200a[p]': 'KOR',
 'Kuwait': 'KWT',
 'Kyrgyzstan': 'KGZ',
 "Lao People's Democratic Republic (the)\u200a[q]": 'LAO',
 'Latvia': 'LVA',
 'Lebanon': 'LBN',
 'Lesotho': 'LSO',
 'Liberia': 'LBR',
 'Libya': 'LBY',
 'Liechtenstein': 'LIE',
 'Lithuania': 'LTU',
 'Luxembourg': 'LUX',
 'Macao\u200a[r]': 'MAC',
 'North Macedonia\u200a[s]': 'MKD',
 'Madagascar': 'MDG',
 'Malawi': 'MWI',
 'Malaysia': 'MYS',
 'Maldives': 'MDV',
 'Mali': 'MLI',
 'Malta': 'MLT',
 'Marshall Islands (the)': 'MHL',
 'Martinique': 'MTQ',
 'Mauritania': 'MRT',
 'Mauritius': 'MUS',
 'Mayotte': 'MYT',
 'Mexico': 'MEX',
 'Micronesia (Federated States of)': 'FSM',
 'Moldova (the Republic of)': 'MDA',
 'Monaco': 'MCO',
 'Mongolia': 'MNG',
 'Montenegro': 'MNE',
 'Montserrat': 'MSR',
 'Morocco': 'MAR',
 'Mozambique': 'MOZ',
 'Myanmar\u200a[t]': 'MMR',
 'Namibia': 'NAM',
 'Nauru': 'NRU',
 'Nepal': 'NPL',
 'Netherlands (the)': 'NLD',
 'New Caledonia': 'NCL',
 'New Zealand': 'NZL',
 'Nicaragua': 'NIC',
 'Niger (the)': 'NER',
 'Nigeria': 'NGA',
 'Niue': 'NIU',
 'Norfolk Island': 'NFK',
 "North Korea – See Korea, The Democratic People's Republic of.": "North Korea – See Korea, The Democratic People's Republic of.",
 'Northern Ireland – See United Kingdom, The.': 'Northern Ireland – See United Kingdom, The.',
 'Northern Mariana Islands (the)': 'MNP',
 'Norway': 'NOR',
 'Oman': 'OMN',
 'Pakistan': 'PAK',
 'Palau': 'PLW',
 'Palestine, State of': 'PSE',
 'Panama': 'PAN',
 'Papua New Guinea': 'PNG',
 'Paraguay': 'PRY',
 "People's Republic of China – See China.": "People's Republic of China – See China.",
 'Peru': 'PER',
 'Philippines (the)': 'PHL',
 'Pitcairn\u200a[u]': 'PCN',
 'Poland': 'POL',
 'Portugal': 'PRT',
 'Puerto Rico': 'PRI',
 'Qatar': 'QAT',
 'Republic of China – See Taiwan (Province of China).': 'Republic of China – See Taiwan (Province of China).',
 'Republic of Korea – See Korea, The Republic of.': 'Republic of Korea – See Korea, The Republic of.',
 'Republic of the Congo – See Congo, The.': 'Republic of the Congo – See Congo, The.',
 'Réunion': 'REU',
 'Romania': 'ROU',
 'Russian Federation (the)\u200a[v]': 'RUS',
 'Rwanda': 'RWA',
 'Saba – See Bonaire, Sint Eustatius and Saba.': 'Saba – See Bonaire, Sint Eustatius and Saba.',
 'Sahrawi Arab Democratic Republic – See Western Sahara.': 'Sahrawi Arab Democratic Republic – See Western Sahara.',
 'Saint Barthélemy': 'BLM',
 'Saint Helena\xa0Ascension Island\xa0Tristan da Cunha': 'SHN',
 'Saint Kitts and Nevis': 'KNA',
 'Saint Lucia': 'LCA',
 'Saint Martin (French part)': 'MAF',
 'Saint Pierre and Miquelon': 'SPM',
 'Saint Vincent and the Grenadines': 'VCT',
 'Samoa': 'WSM',
 'San Marino': 'SMR',
 'Sao Tome and Principe': 'STP',
 'Saudi Arabia': 'SAU',
 'Scotland – See United Kingdom, The.': 'Scotland – See United Kingdom, The.',
 'Senegal': 'SEN',
 'Serbia': 'SRB',
 'Seychelles': 'SYC',
 'Sierra Leone': 'SLE',
 'Singapore': 'SGP',
 'Sint Eustatius – See Bonaire, Sint Eustatius and Saba.': 'Sint Eustatius – See Bonaire, Sint Eustatius and Saba.',
 'Sint Maarten (Dutch part)': 'SXM',
 'Slovakia': 'SVK',
 'Slovenia': 'SVN',
 'Solomon Islands': 'SLB',
 'Somalia': 'SOM',
 'South Africa': 'ZAF',
 'South Georgia and the South Sandwich Islands': 'SGS',
 'South Korea – See Korea, The Republic of.': 'South Korea – See Korea, The Republic of.',
 'South Sudan': 'SSD',
 'Spain': 'ESP',
 'Sri Lanka': 'LKA',
 'Sudan (the)': 'SDN',
 'Suriname': 'SUR',
 'Svalbard\xa0Jan Mayen': 'SJM',
 'Sweden': 'SWE',
 'Switzerland': 'CHE',
 'Syrian Arab Republic (the)\u200a[x]': 'SYR',
 'Taiwan (Province of China)\u200a[y]': 'TWN',
 'Tajikistan': 'TJK',
 'Tanzania, the United Republic of': 'TZA',
 'Thailand': 'THA',
 'Timor-Leste\u200a[aa]': 'TLS',
 'Togo': 'TGO',
 'Tokelau': 'TKL',
 'Tonga': 'TON',
 'Trinidad and Tobago': 'TTO',
 'Tunisia': 'TUN',
 'Turkey': 'TUR',
 'Turkmenistan': 'TKM',
 'Turks and Caicos Islands (the)': 'TCA',
 'Tuvalu': 'TUV',
 'Uganda': 'UGA',
 'Ukraine': 'UKR',
 'United Arab Emirates (the)': 'ARE',
 'United Kingdom of Great Britain and Northern Ireland (the)': 'GBR',
 'United States Minor Outlying Islands (the)\u200a[ac]': 'UMI',
 'United States of America (the)': 'USA',
 'United States Virgin Islands – See Virgin Islands (U.S.).': 'United States Virgin Islands – See Virgin Islands (U.S.).',
 'Uruguay': 'URY',
 'Uzbekistan': 'UZB',
 'Vanuatu': 'VUT',
 'Vatican City – See Holy See, The.': 'Vatican City – See Holy See, The.',
 'Venezuela (Bolivarian Republic of)': 'VEN',
 'Viet Nam\u200a[ae]': 'VNM',
 'Virgin Islands (British)\u200a[af]': 'VGB',
 'Virgin Islands (U.S.)\u200a[ag]': 'VIR',
 'Wales – See United Kingdom, The.': 'Wales – See United Kingdom, The.',
 'Wallis and Futuna': 'WLF',
 'Western Sahara\u200a[ah]': 'ESH',
 'Yemen': 'YEM',
 'Zambia': 'ZMB',
 'Zimbabwe': 'ZWE',
 'United States': 'USA',
 'United Kingdom': 'GBR',
 'Venezuela': 'VEN',
 'Australia': 'AUS',
 'Iran': 'IRN',
 'France': 'FRA',
 'Russia': 'RUS',
 'Korea, North': 'PRK',
 'Korea, South': 'KOR',
 'Myanmar': 'MMR',
 'Burma': 'MMR',
 'Vietnam': 'VNM',
 'Laos': 'LAO',
 'Bolivia': 'BOL',
 'Niger': 'NER',
 'Sudan': 'SDN',
 'Congo, Dem. Rep.': 'COD',
 'Congo, Repub. of the': 'COG',
 'Tanzania': 'TZA',
 'Central African Rep.': 'CAF',
"Cote d'Ivoire": 'CIV'}df['ISO Code'] = df['Country'].map(iso_mapping)df['Cluster'] = model.labels_import plotly.express as px
fig = px.choropleth(df, locations="ISO Code",
color="Cluster", # lifeExp is a column of gapminder
hover_name="Country", # column to add to hover information
color_continuous_scale='Turbo'
)
fig.show()