K-Means Clustering
Let's work through an example of unsupervised learning - clustering customer data.
Goal:
When working with unsupervised learning methods, its usually important to lay out a general goal. In our case, let's attempt to find reasonable clusters of customers for marketing segmentation and study. What we end up doing with those clusters would depend heavily on the domain itself, in this case, marketing.
The Data
LINK: https://archive.ics.uci.edu/ml/datasets/bank+marketing
This dataset is public available for research. The details are described in [Moro et al., 2011].
[Moro et al., 2011] S. Moro, R. Laureano and P. Cortez. Using Data Mining for Bank Direct Marketing: An Application of the CRISP-DM Methodology. In P. Novais et al. (Eds.), Proceedings of the European Simulation and Modelling Conference - ESM'2011, pp. 117-121, Guimarães, Portugal, October, 2011. EUROSIS.
Available at: [pdf] http://hdl.handle.net/1822/14838 [bib] http://www3.dsi.uminho.pt/pcortez/bib/2011-esm-1.txt For more information, read [Moro et al., 2011].
bank client data:
1 - age (numeric) 2 - job : type of job (categorical: 'admin.','blue-collar','entrepreneur','housemaid','management','retired','self-employed','services','student','technician','unemployed','unknown') 3 - marital : marital status (categorical: 'divorced','married','single','unknown'; note: 'divorced' means divorced or widowed) 4 - education (categorical: 'basic.4y','basic.6y','basic.9y','high.school','illiterate','professional.course','university.degree','unknown') 5 - default: has credit in default? (categorical: 'no','yes','unknown') 6 - housing: has housing loan? (categorical: 'no','yes','unknown') 7 - loan: has personal loan? (categorical: 'no','yes','unknown')
related with the last contact of the current campaign:
8 - contact: contact communication type (categorical: 'cellular','telephone') 9 - month: last contact month of year (categorical: 'jan', 'feb', 'mar', ..., 'nov', 'dec') 10 - day_of_week: last contact day of the week (categorical: 'mon','tue','wed','thu','fri') 11 - duration: last contact duration, in seconds (numeric). Important note: this attribute highly affects the output target (e.g., if duration=0 then y='no'). Yet, the duration is not known before a call is performed. Also, after the end of the call y is obviously known. Thus, this input should only be included for benchmark purposes and should be discarded if the intention is to have a realistic predictive model.
other attributes:
12 - campaign: number of contacts performed during this campaign and for this client (numeric, includes last contact) 13 - pdays: number of days that passed by after the client was last contacted from a previous campaign (numeric; 999 means client was not previously contacted) 14 - previous: number of contacts performed before this campaign and for this client (numeric) 15 - poutcome: outcome of the previous marketing campaign (categorical: 'failure','nonexistent','success')
social and economic context attributes
16 - emp.var.rate: employment variation rate - quarterly indicator (numeric) 17 - cons.price.idx: consumer price index - monthly indicator (numeric) 18 - cons.conf.idx: consumer confidence index - monthly indicator (numeric) 19 - euribor3m: euribor 3 month rate - daily indicator (numeric) 20 - nr.employed: number of employees - quarterly indicator (numeric) 21 - y - has the client subscribed a term deposit? (binary: 'yes','no')
Imports
Exploratory Data Analysis
df = pd.read_csv("../DATA/bank-full.csv")df.head()age
job
marital
education
default127 more lines
housing
loan
contact
month
day_of_week
...
campaign
pdays
previous
poutcome
emp.var.rate
cons.price.idx
cons.conf.idx
euribor3m
nr.employed
subscribed
0
56
housemaid
married
basic.4y
no
no
no
telephone
may
mon
...
1
999
0
nonexistent
1.1
93.994
-36.4
4.857
5191.0
no
1
57
services
married
high.school
unknown
no
no
telephone
may
mon
...
1
999
0
nonexistent
1.1
93.994
-36.4
4.857
5191.0
no
2
37
services
married
high.school
no
yes
no
telephone
may
mon
...
1
999
0
nonexistent
1.1
93.994
-36.4
4.857
5191.0
no
3
40
admin.
married
basic.6y
no
no
no
telephone
may
mon
...
1
999
0
nonexistent
1.1
93.994
-36.4
4.857
5191.0
no
4
56
services
married
high.school
no
no
yes
telephone
may
mon
...
1
999
0
nonexistent
1.1
93.994
-36.4
4.857
5191.0
no
5 rows × 21 columnsdf.columnsIndex(['age', 'job', 'marital', 'education', 'default', 'housing', 'loan',
'contact', 'month', 'day_of_week', 'duration', 'campaign', 'pdays',
'previous', 'poutcome', 'emp.var.rate', 'cons.price.idx',
'cons.conf.idx', 'euribor3m', 'nr.employed', 'subscribed'],
dtype='object')df.info()<class 'pandas.core.frame.DataFrame'>
RangeIndex: 41188 entries, 0 to 41187
Data columns (total 21 columns):
# Column Non-Null Count Dtype
--- ------ -------------- ----- 23 more lines
 0   age             41188 non-null  int64
 1   job             41188 non-null  object
 2   marital         41188 non-null  object
 3   education       41188 non-null  object
 4   default         41188 non-null  object
 5   housing         41188 non-null  object
 6   loan            41188 non-null  object
 7   contact         41188 non-null  object
 8   month           41188 non-null  object
 9   day_of_week     41188 non-null  object
 10  duration        41188 non-null  int64
 11  campaign        41188 non-null  int64
 12  pdays           41188 non-null  int64
 13  previous        41188 non-null  int64
 14  poutcome        41188 non-null  object
 15  emp.var.rate    41188 non-null  float64
 16  cons.price.idx  41188 non-null  float64
 17  cons.conf.idx   41188 non-null  float64
 18  euribor3m       41188 non-null  float64
 19  nr.employed     41188 non-null  float64
 20  subscribed      41188 non-null  object
dtypes: float64(5), int64(5), object(11)
memory usage: 6.6+ MB
Continuous Feature Analysis
plt.figure(figsize=(12,6),dpi=200)
sns.histplot(data=df,x='age')<AxesSubplot:xlabel='age', ylabel='Count'>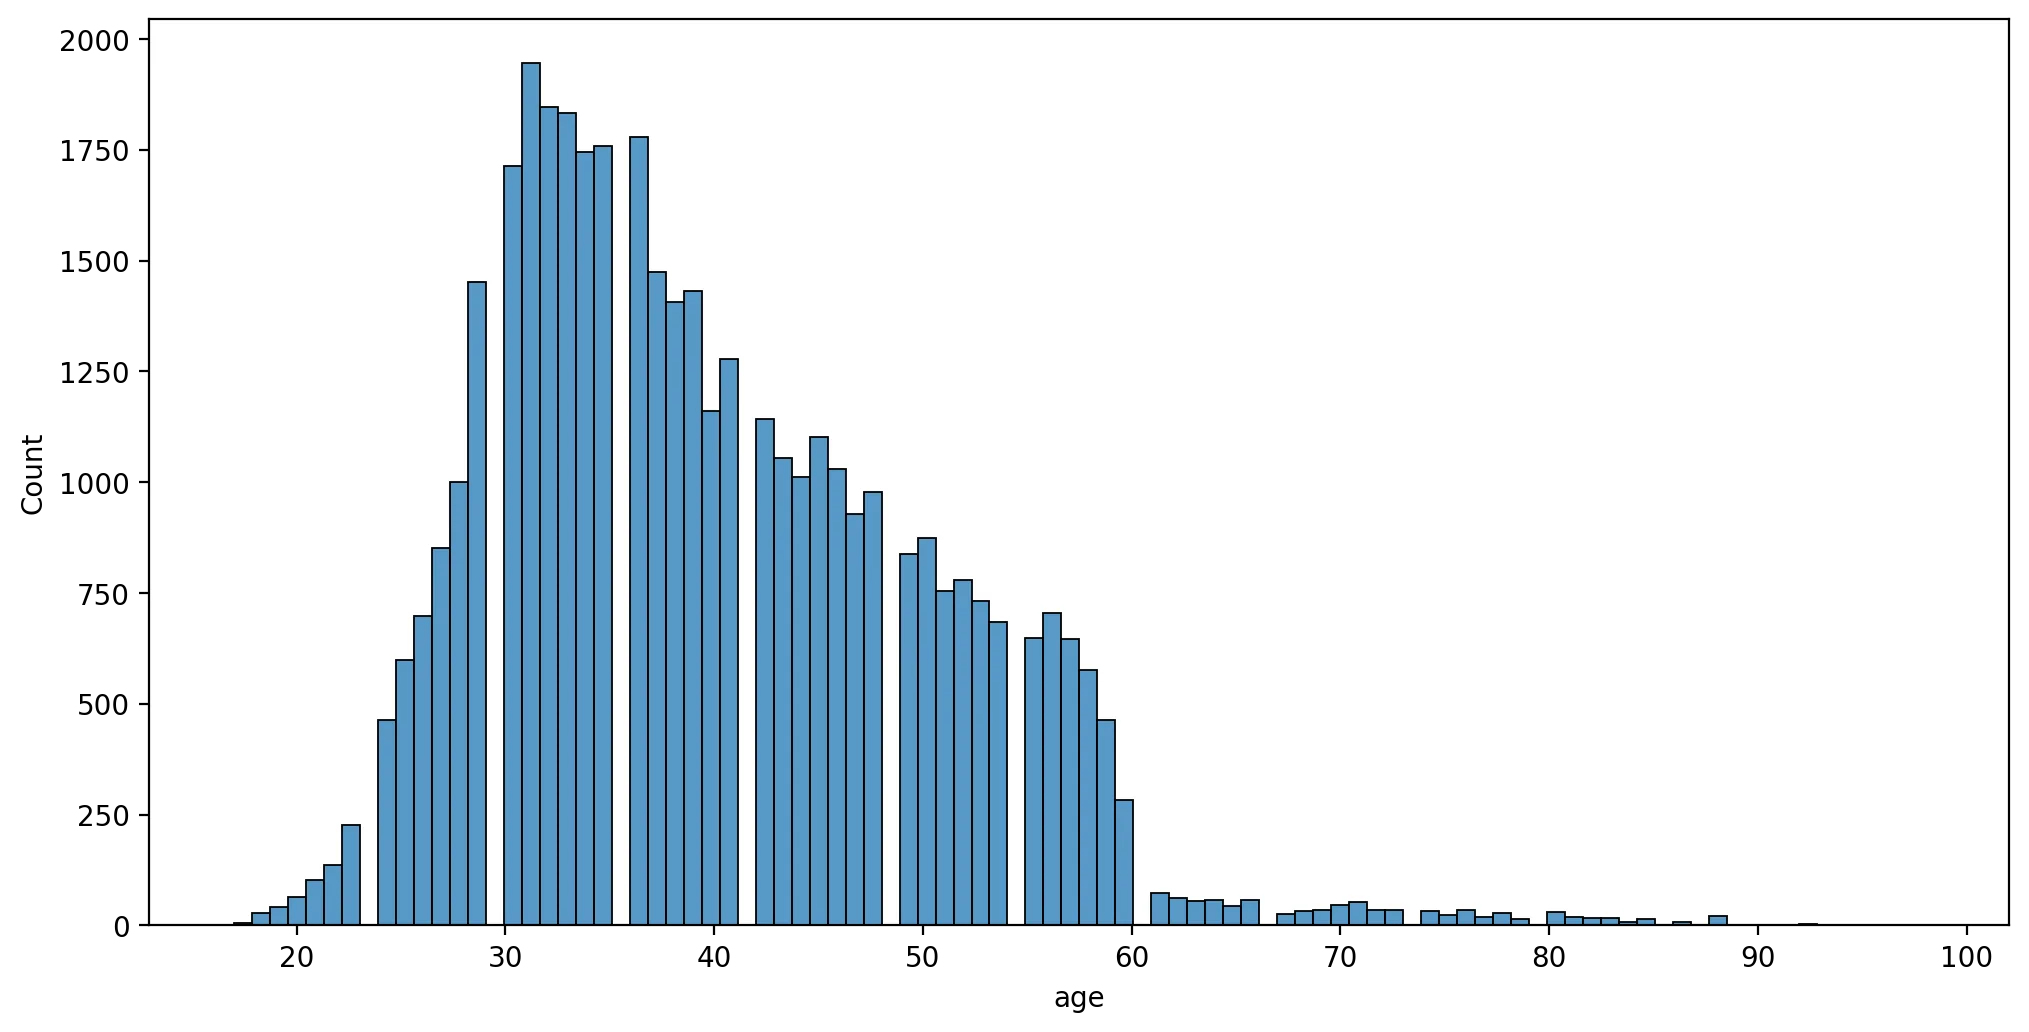
plt.figure(figsize=(12,6),dpi=200)
sns.histplot(data=df,x='age',hue='loan')<AxesSubplot:xlabel='age', ylabel='Count'>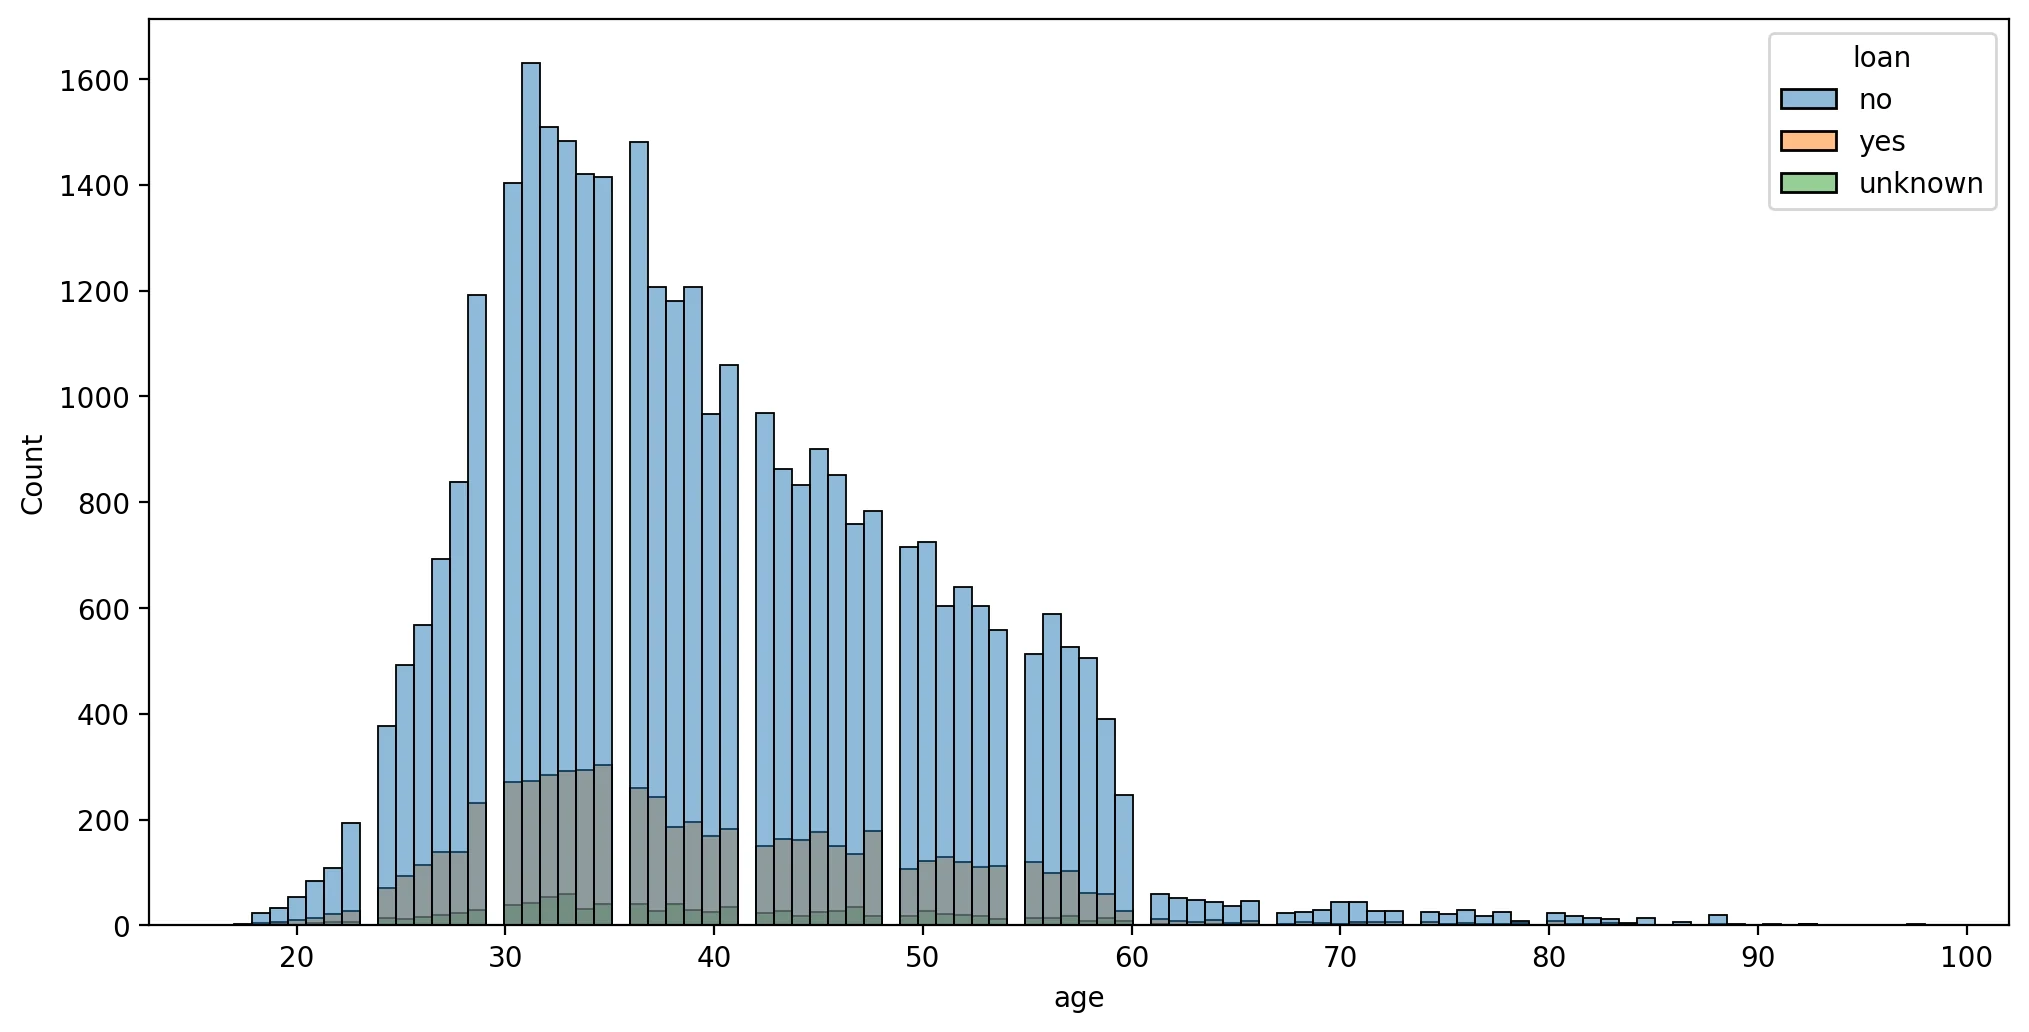
plt.figure(figsize=(12,6),dpi=200)
sns.histplot(data=df,x='pdays')<AxesSubplot:xlabel='pdays', ylabel='Count'>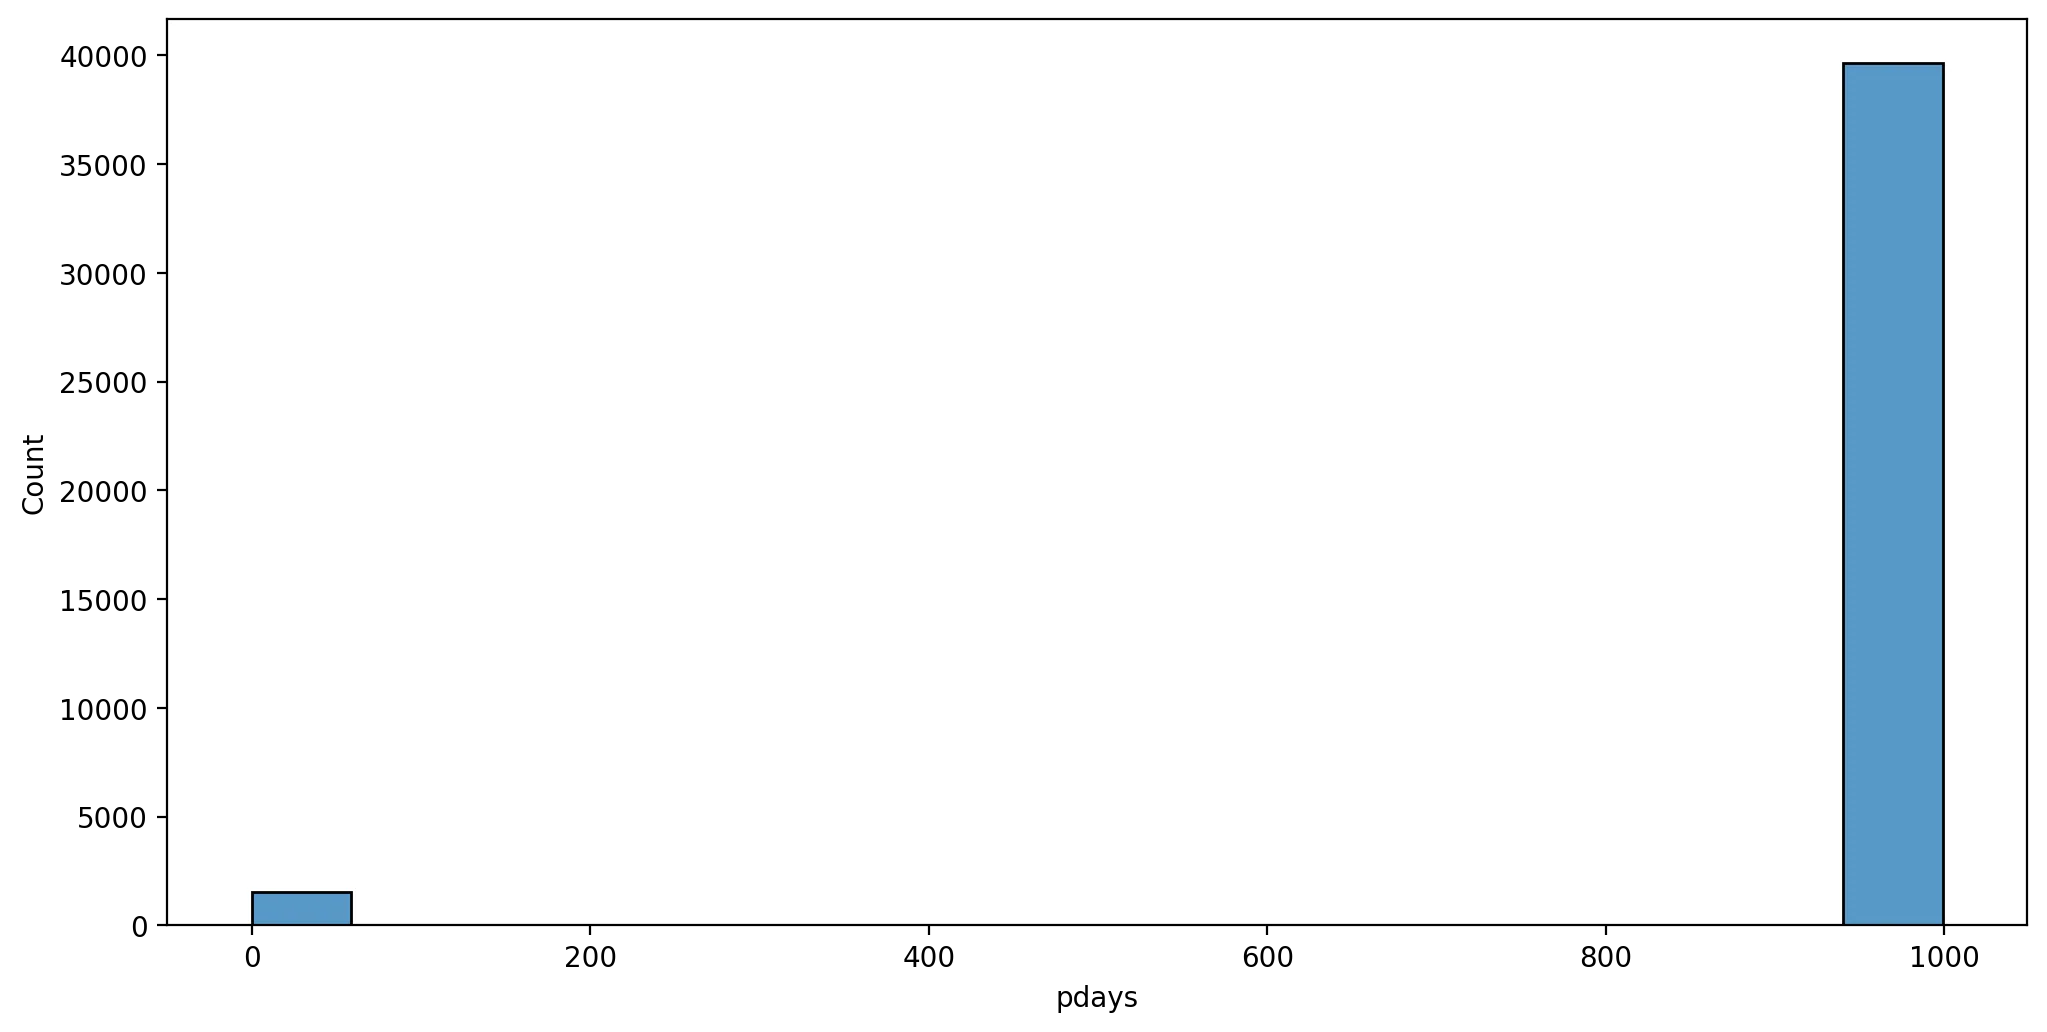
plt.figure(figsize=(12,6),dpi=200)
sns.histplot(data=df[df['pdays']!=999],x='pdays')<AxesSubplot:xlabel='pdays', ylabel='Count'>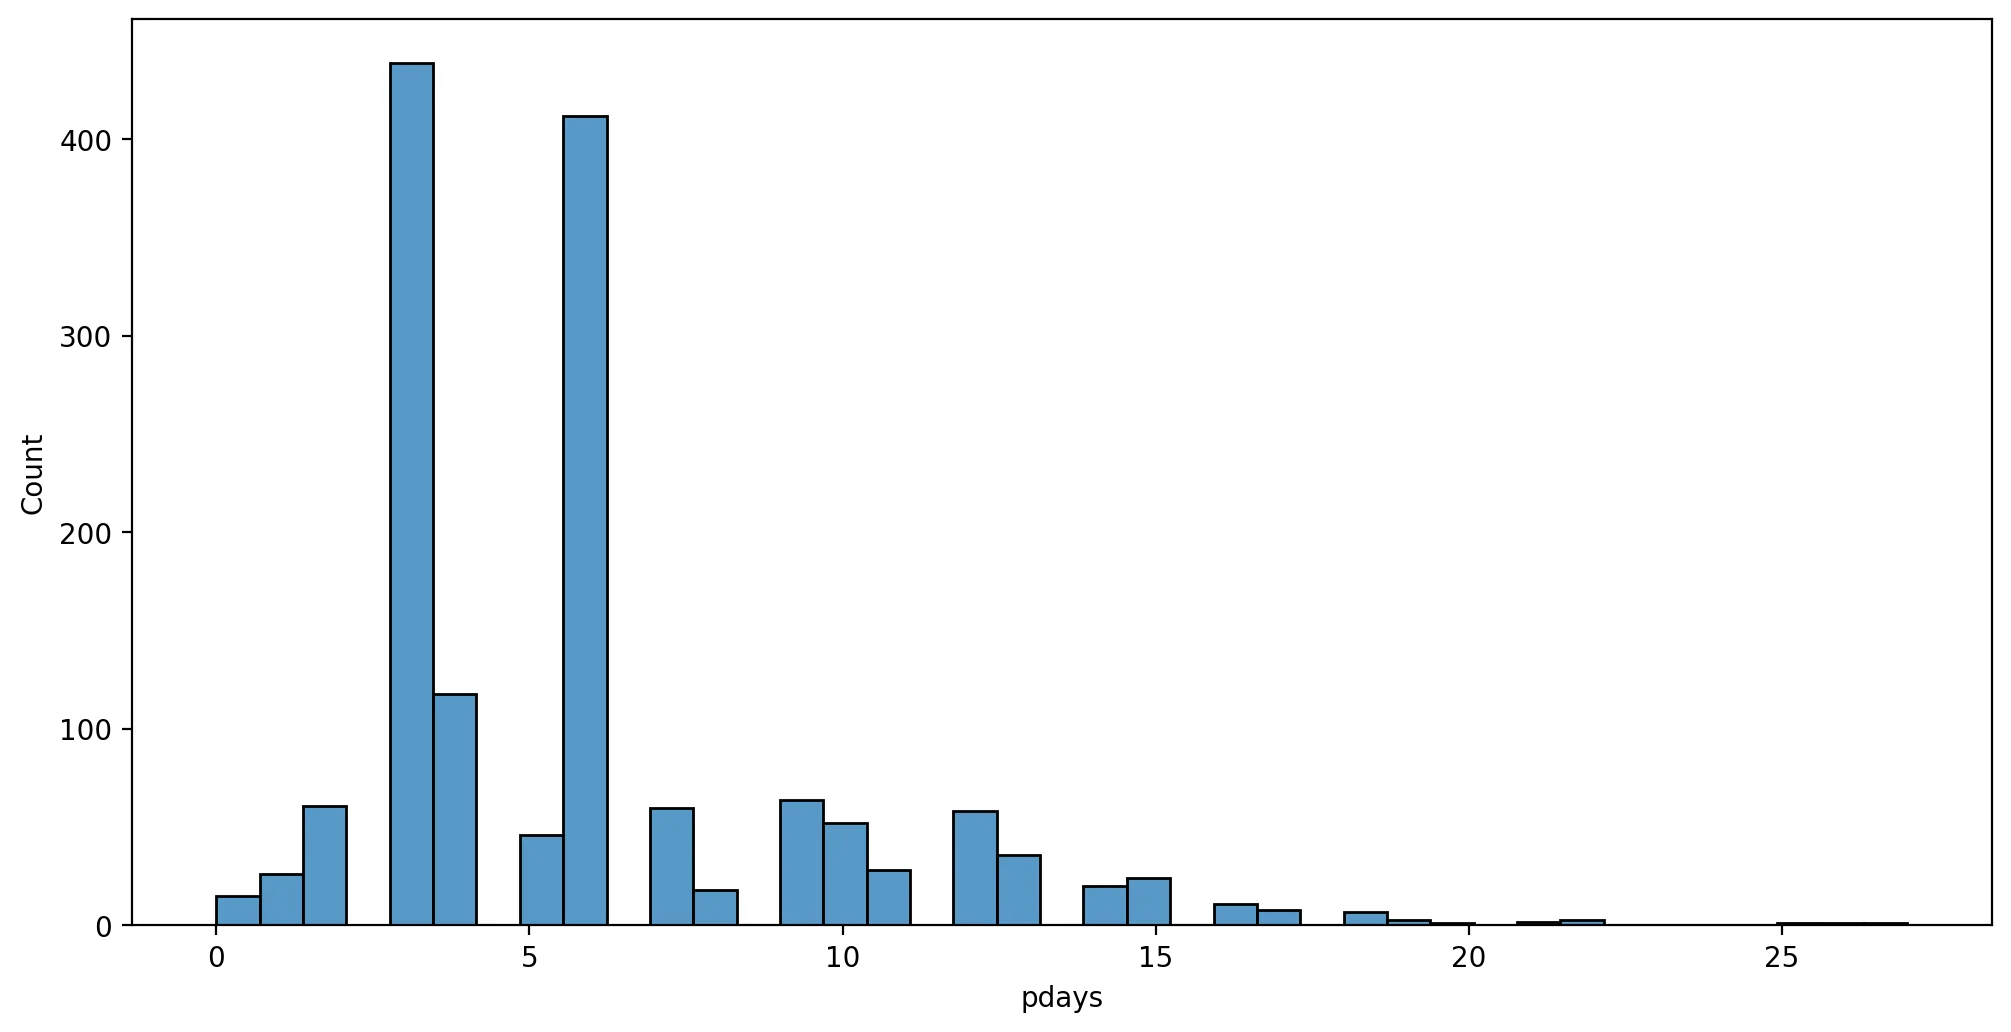
Contact duration - contact with customer made, how long did call last?
plt.figure(figsize=(12,6),dpi=200)
sns.histplot(data=df,x='duration',hue='contact')
plt.xlim(0,2000)(0.0, 2000.0)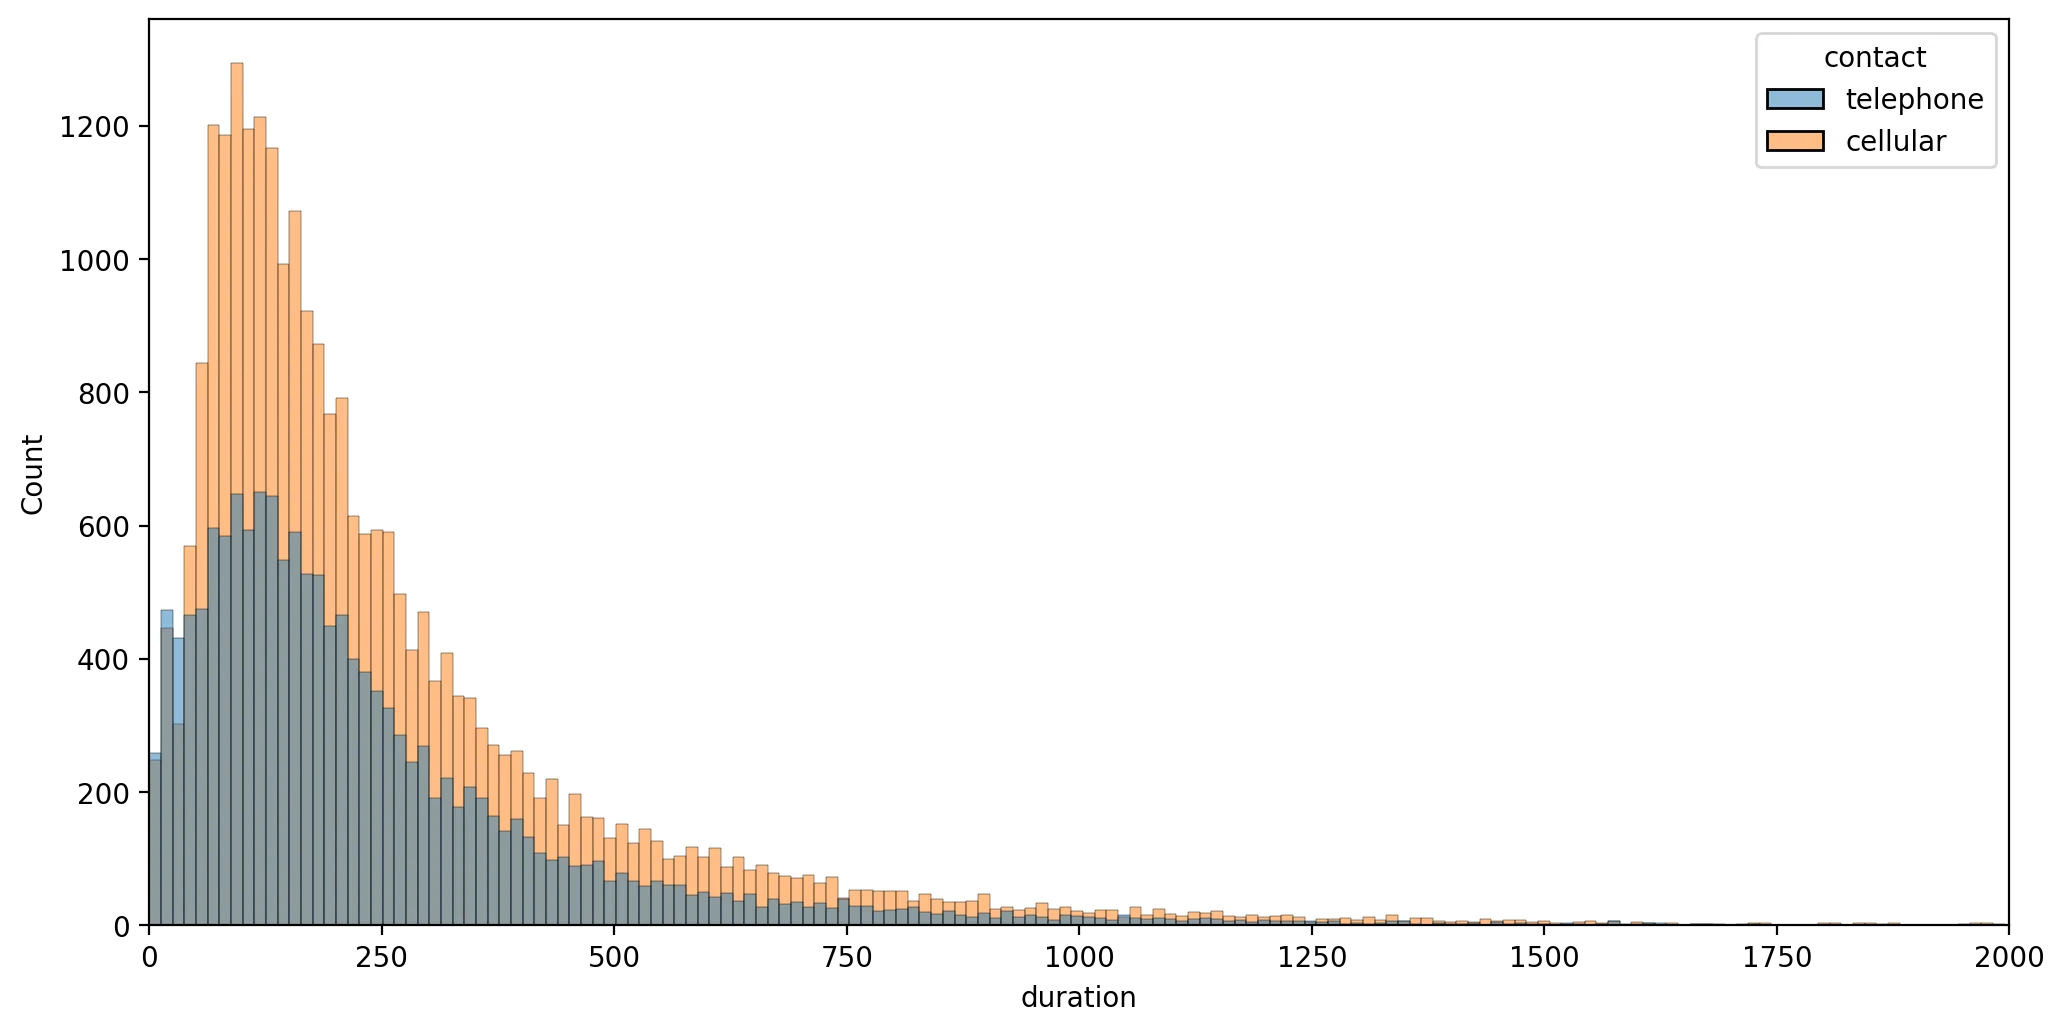
- 15 - previous: number of contacts performed before this campaign and for this client (numeric)
- 16 - poutcome: outcome of the previous marketing campaign (categorical: "unknown","other","failure","success"
plt.figure(figsize=(12,6),dpi=200)
sns.countplot(data=df,x='previous',hue='contact')<AxesSubplot:xlabel='previous', ylabel='count'>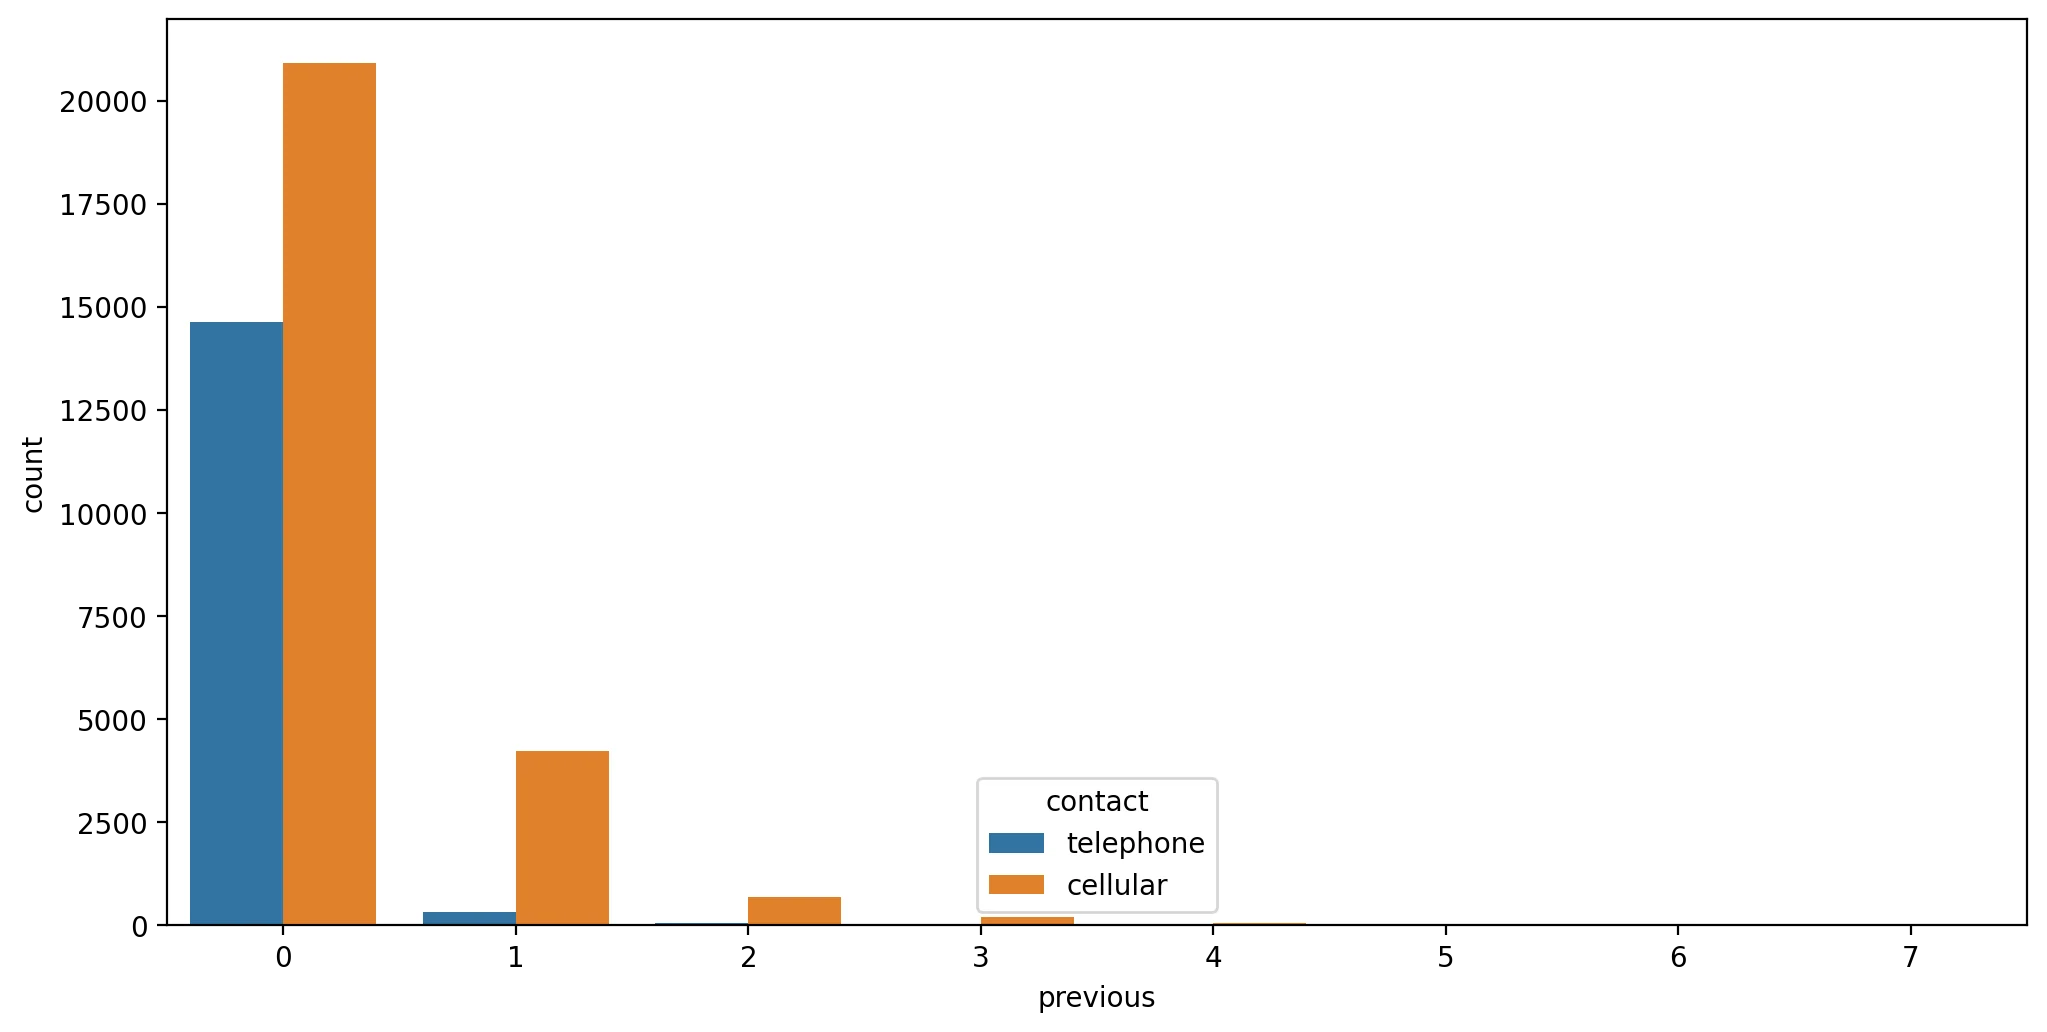
sns.countplot(data=df,x='contact')<AxesSubplot:xlabel='contact', ylabel='count'>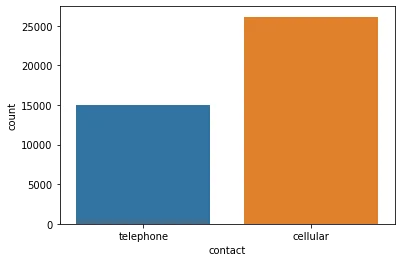
# df['previous'].value_counts()
df['previous'].value_counts().sum()-36954
# 36954 vs. 82574234Categorical Features
df.head()age
job
marital
education
default127 more lines
housing
loan
contact
month
day_of_week
...
campaign
pdays
previous
poutcome
emp.var.rate
cons.price.idx
cons.conf.idx
euribor3m
nr.employed
subscribed
0
56
housemaid
married
basic.4y
no
no
no
telephone
may
mon
...
1
999
0
nonexistent
1.1
93.994
-36.4
4.857
5191.0
no
1
57
services
married
high.school
unknown
no
no
telephone
may
mon
...
1
999
0
nonexistent
1.1
93.994
-36.4
4.857
5191.0
no
2
37
services
married
high.school
no
yes
no
telephone
may
mon
...
1
999
0
nonexistent
1.1
93.994
-36.4
4.857
5191.0
no
3
40
admin.
married
basic.6y
no
no
no
telephone
may
mon
...
1
999
0
nonexistent
1.1
93.994
-36.4
4.857
5191.0
no
4
56
services
married
high.school
no
no
yes
telephone
may
mon
...
1
999
0
nonexistent
1.1
93.994
-36.4
4.857
5191.0
no
5 rows × 21 columnsplt.figure(figsize=(12,6),dpi=200)
# https://stackoverflow.com/questions/46623583/seaborn-countplot-order-categories-by-count
sns.countplot(data=df,x='job',order=df['job'].value_counts().index)
plt.xticks(rotation=90);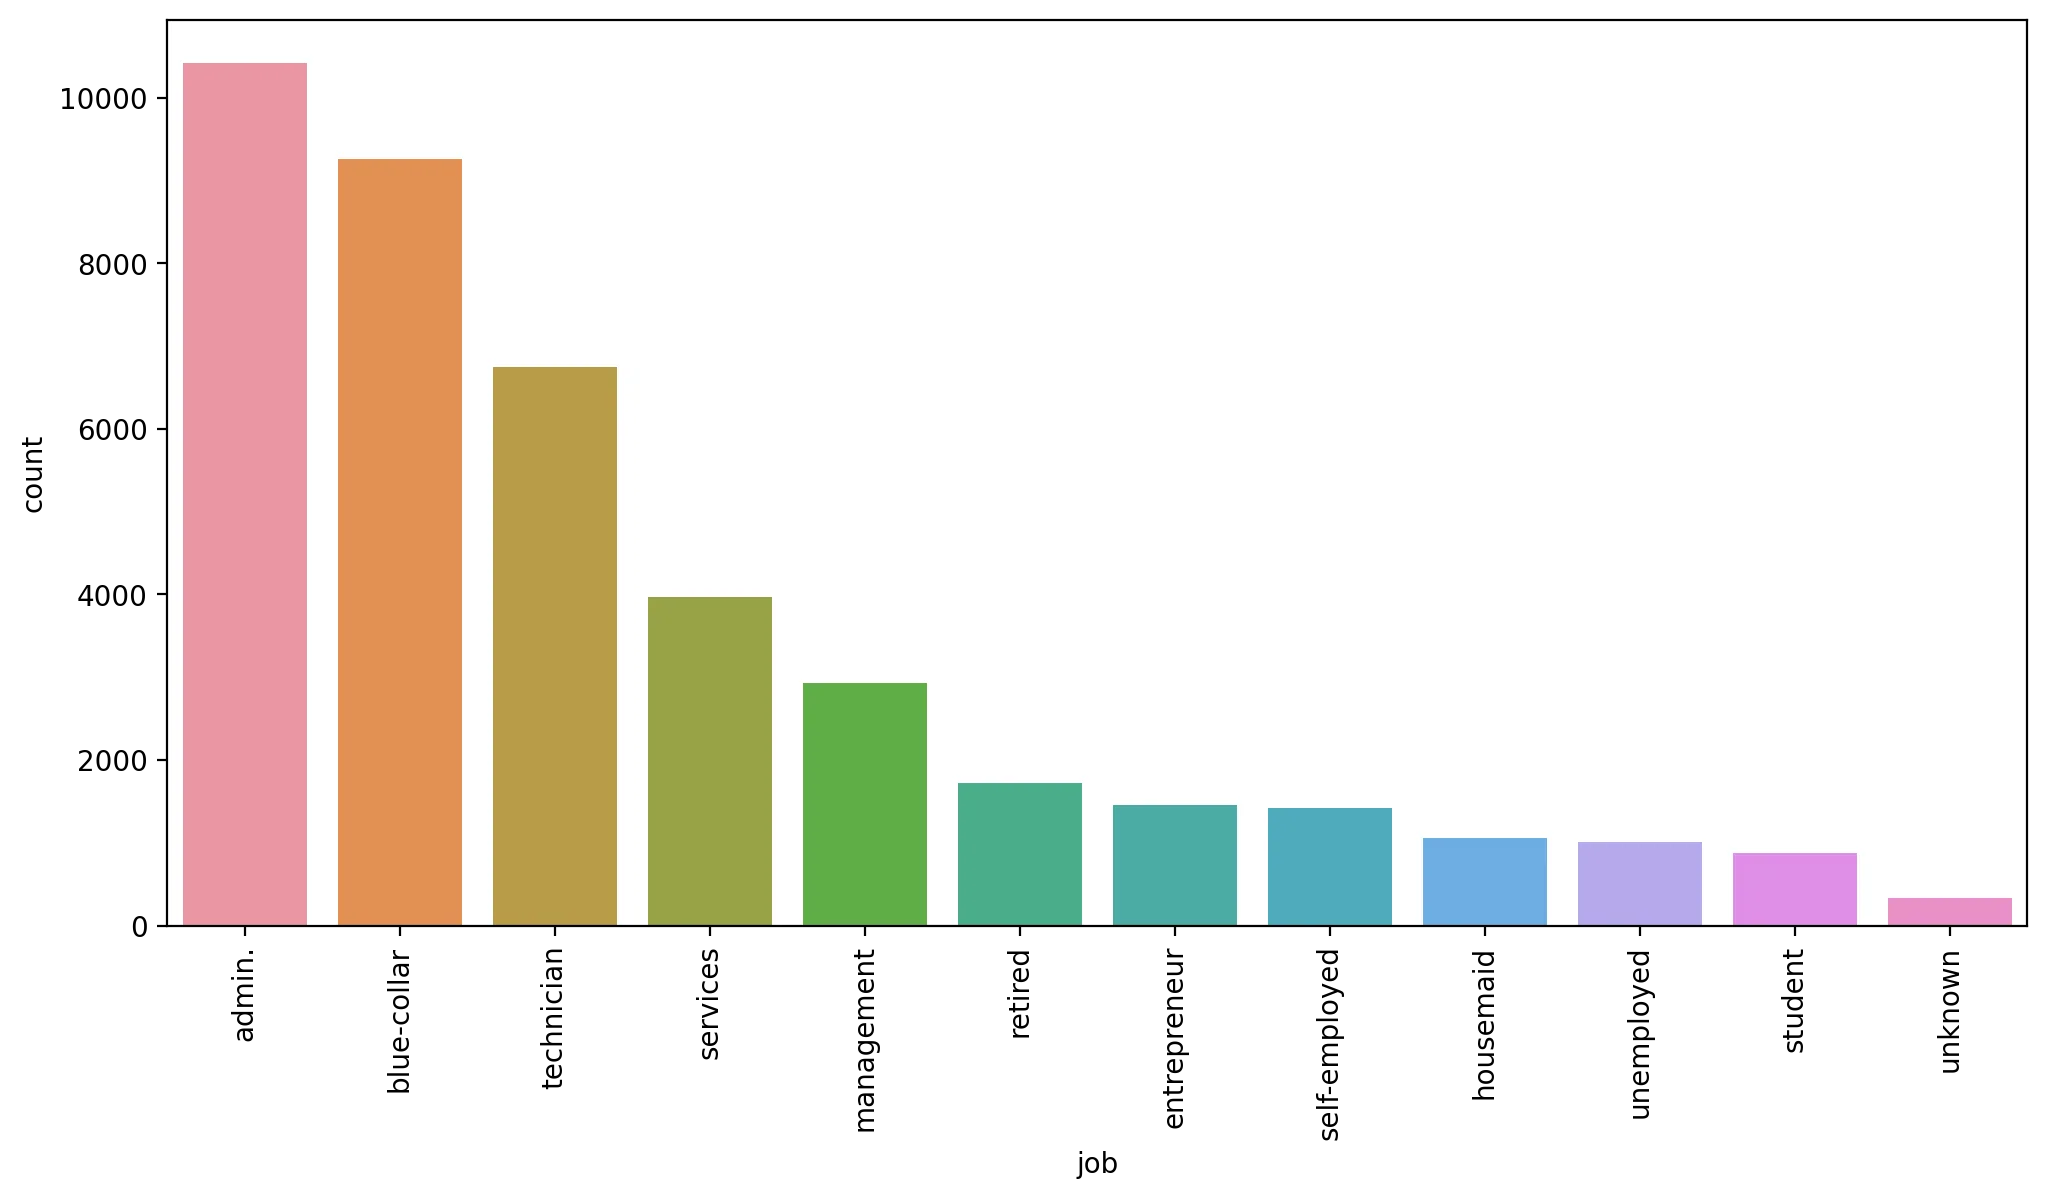
plt.figure(figsize=(12,6),dpi=200)
# https://stackoverflow.com/questions/46623583/seaborn-countplot-order-categories-by-count
sns.countplot(data=df,x='education',order=df['education'].value_counts().index)
plt.xticks(rotation=90);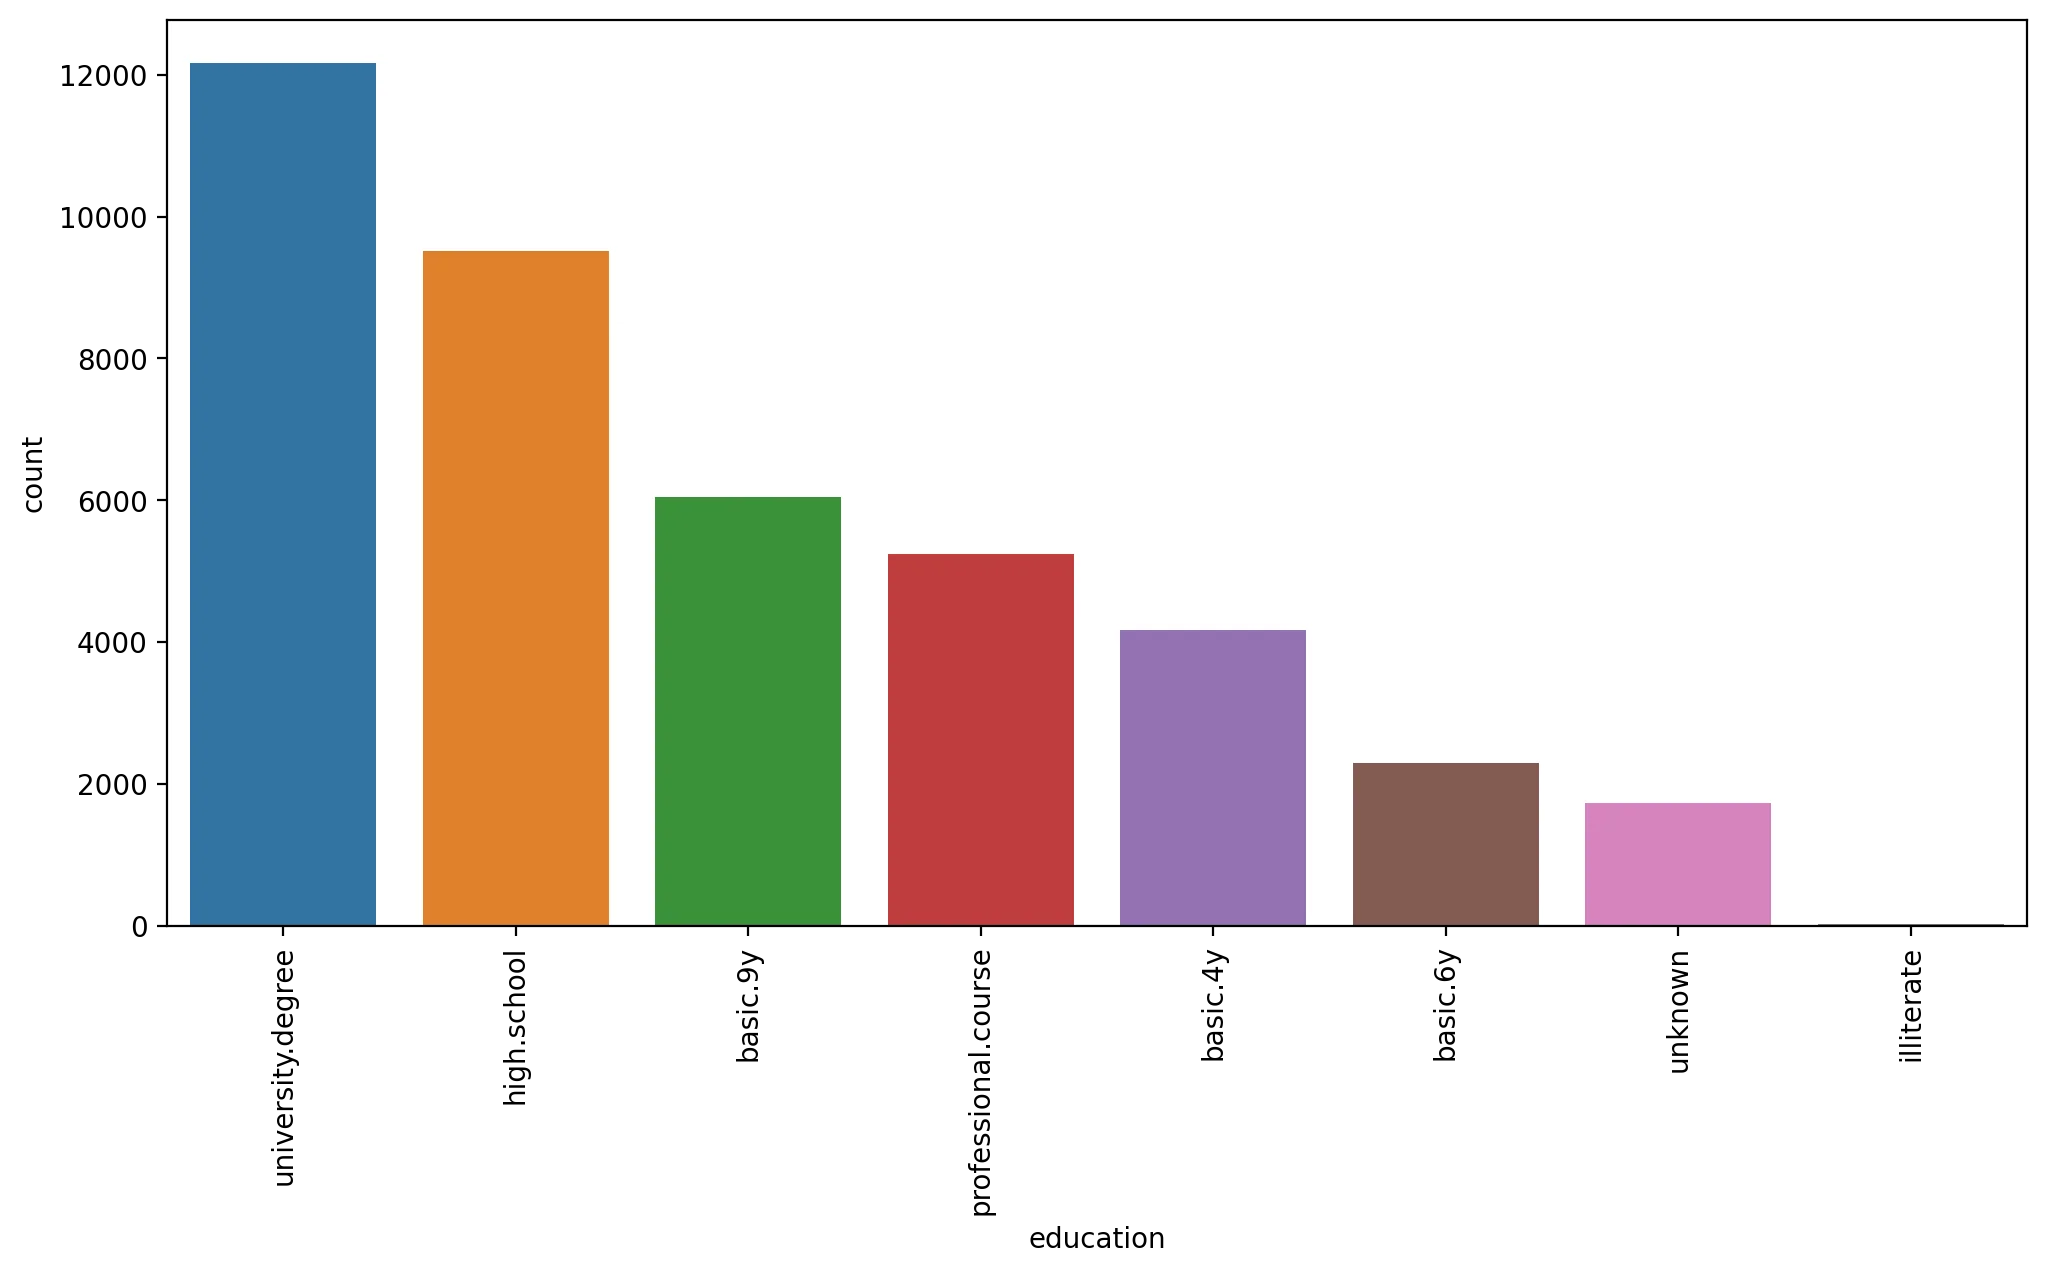
plt.figure(figsize=(12,6),dpi=200)
# https://stackoverflow.com/questions/46623583/seaborn-countplot-order-categories-by-count
sns.countplot(data=df,x='education',order=df['education'].value_counts().index,hue='default')
plt.xticks(rotation=90);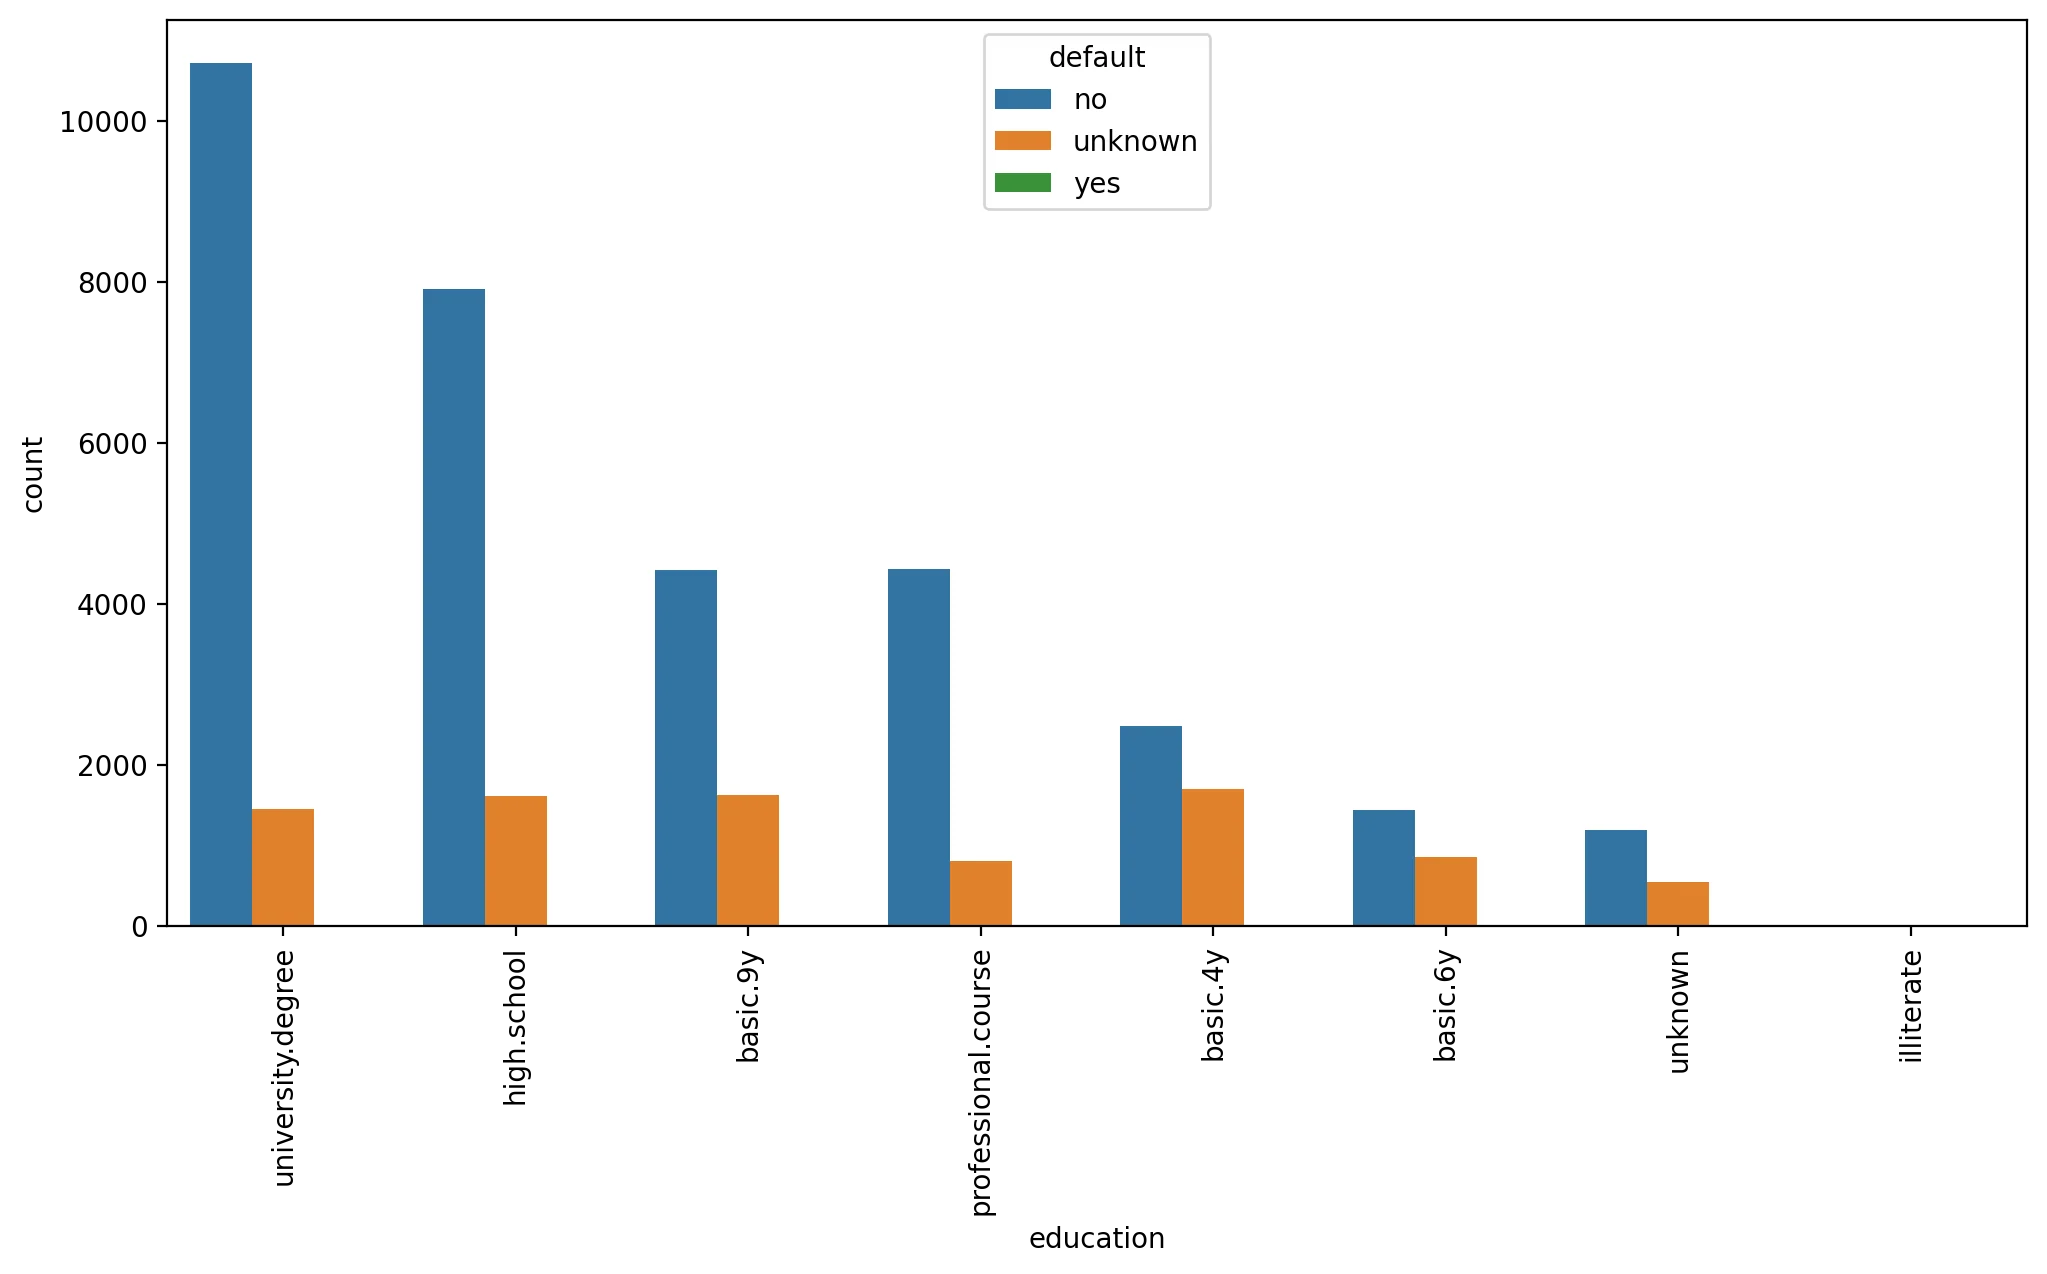
sns.countplot(data=df,x='default')<AxesSubplot:xlabel='default', ylabel='count'>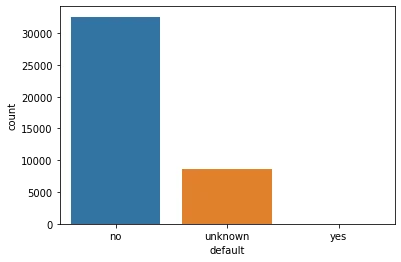
# THIS TAKES A LONG TIME!
sns.pairplot(df)<seaborn.axisgrid.PairGrid at 0x209136c9490>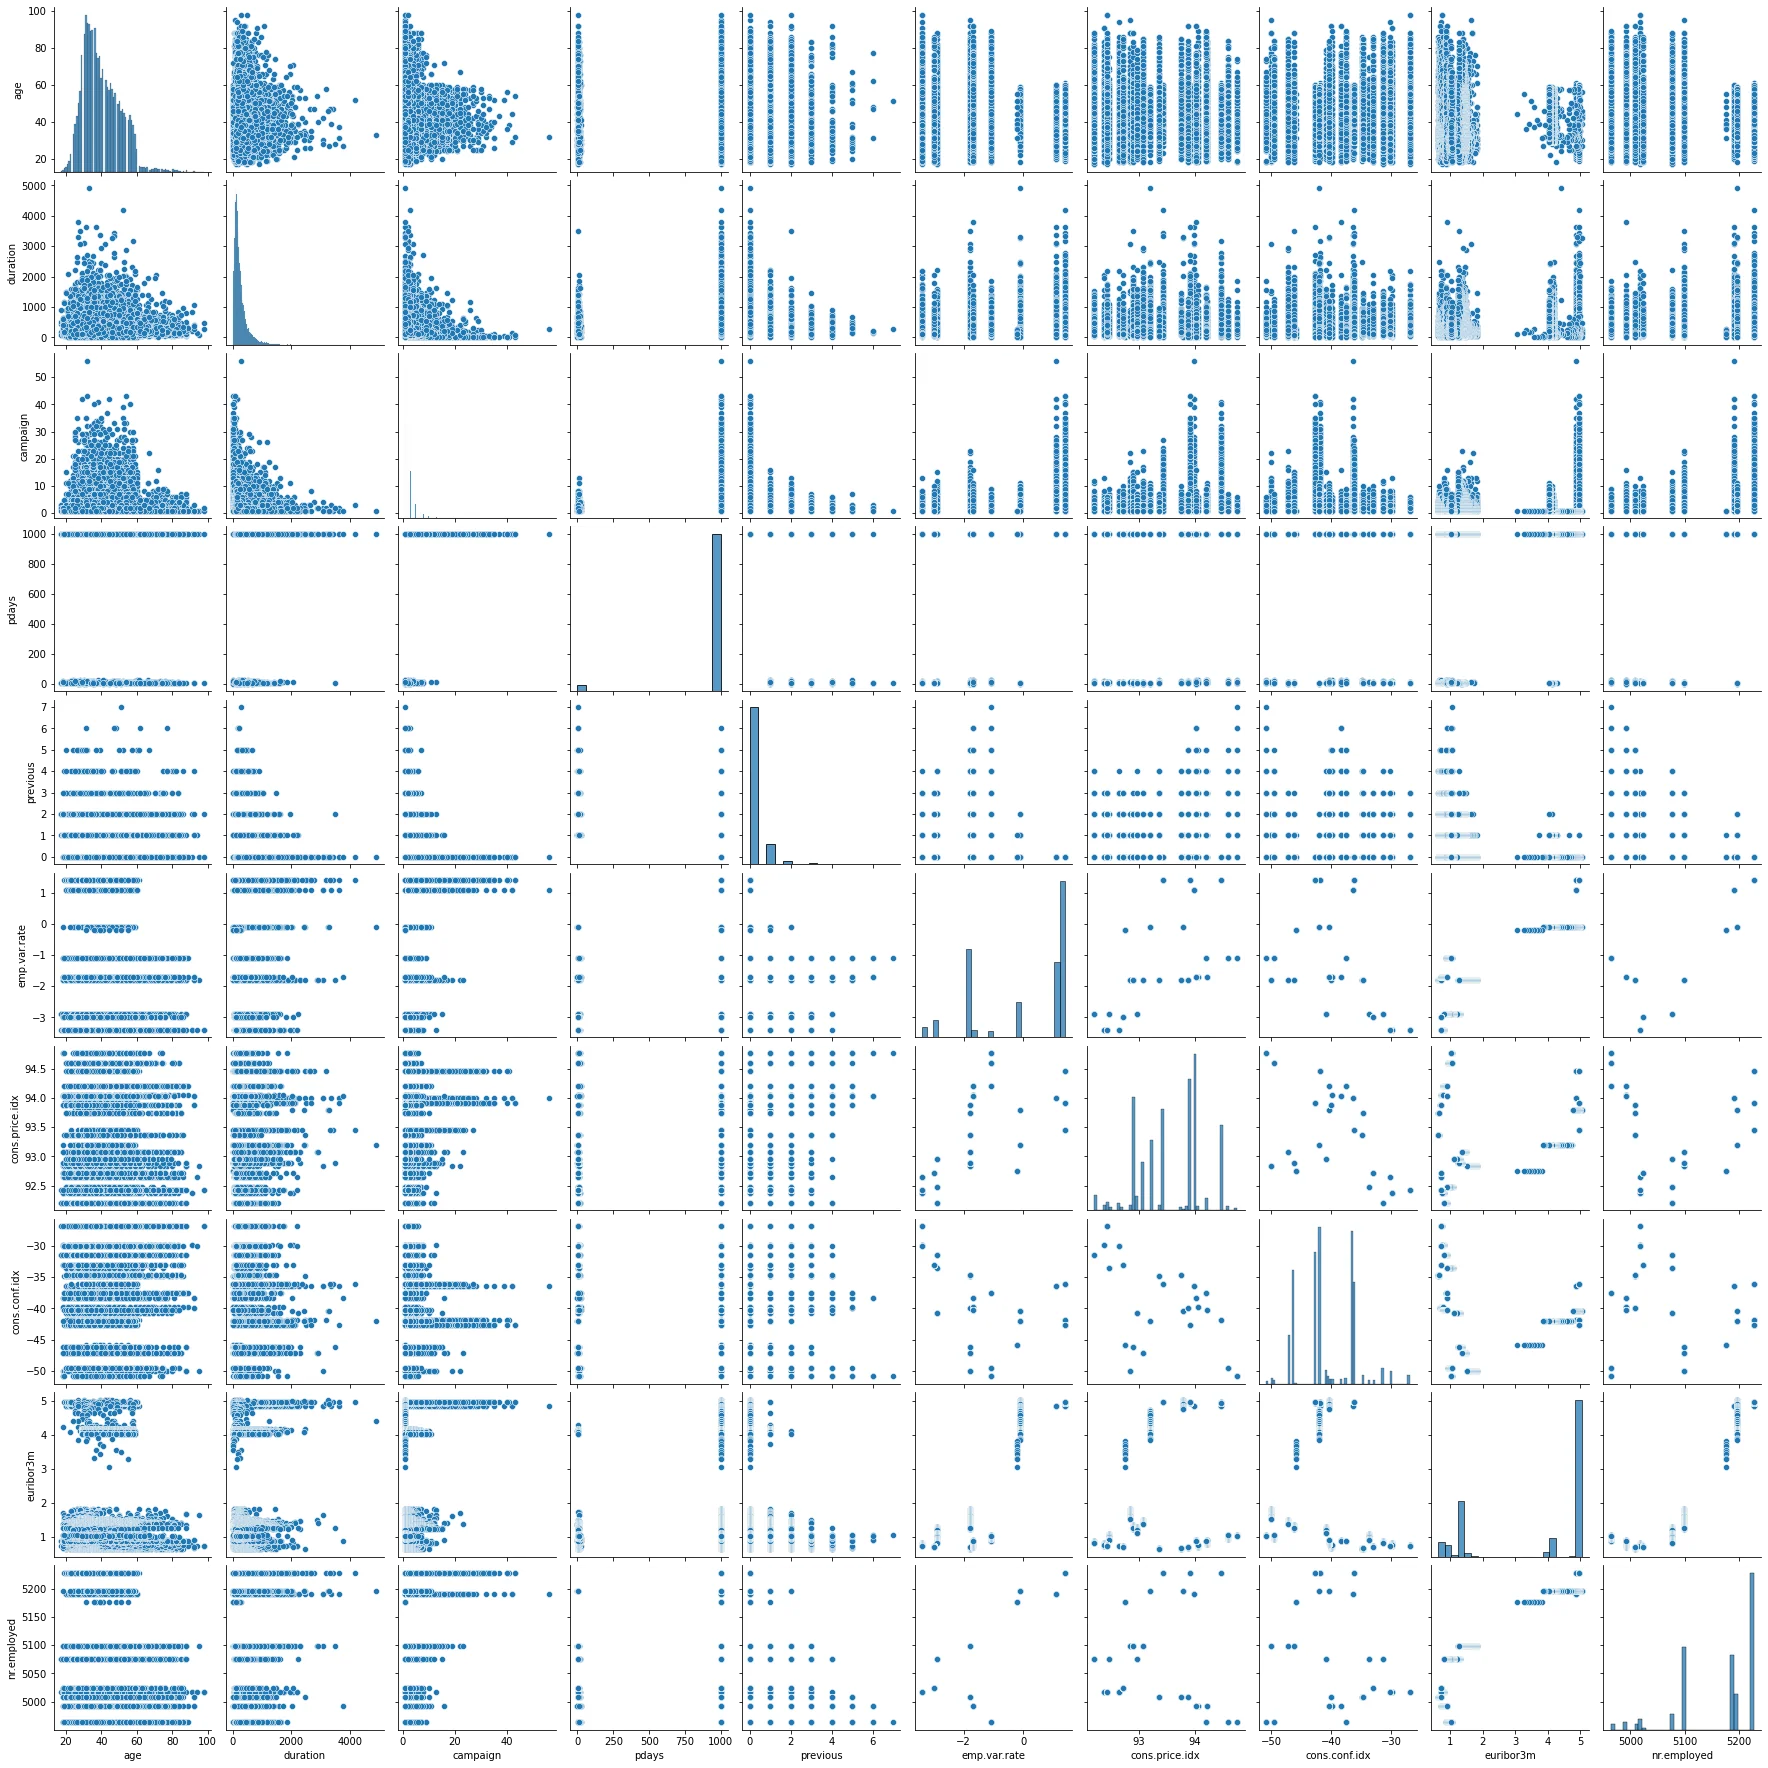
Clustering
Data Preparation
UNSUPERVISED LEARNING REMINDER: NO NEED TO TRAIN TEST SPLIT!! NO LABEL TO "TEST" AGAINST!
We do however need to transform categorical features into numeric ones where it makes sense to do so, as well as scaling the data due to distance being a key factor in clustering.
df.head()age
job
marital
education
default127 more lines
housing
loan
contact
month
day_of_week
...
campaign
pdays
previous
poutcome
emp.var.rate
cons.price.idx
cons.conf.idx
euribor3m
nr.employed
subscribed
0
56
housemaid
married
basic.4y
no
no
no
telephone
may
mon
...
1
999
0
nonexistent
1.1
93.994
-36.4
4.857
5191.0
no
1
57
services
married
high.school
unknown
no
no
telephone
may
mon
...
1
999
0
nonexistent
1.1
93.994
-36.4
4.857
5191.0
no
2
37
services
married
high.school
no
yes
no
telephone
may
mon
...
1
999
0
nonexistent
1.1
93.994
-36.4
4.857
5191.0
no
3
40
admin.
married
basic.6y
no
no
no
telephone
may
mon
...
1
999
0
nonexistent
1.1
93.994
-36.4
4.857
5191.0
no
4
56
services
married
high.school
no
no
yes
telephone
may
mon
...
1
999
0
nonexistent
1.1
93.994
-36.4
4.857
5191.0
no
5 rows × 21 columnsX = pd.get_dummies(df)Xage
duration
campaign
pdays
previous259 more lines
emp.var.rate
cons.price.idx
cons.conf.idx
euribor3m
nr.employed
...
day_of_week_fri
day_of_week_mon
day_of_week_thu
day_of_week_tue
day_of_week_wed
poutcome_failure
poutcome_nonexistent
poutcome_success
subscribed_no
subscribed_yes
0
56
261
1
999
0
1.1
93.994
-36.4
4.857
5191.0
...
0
1
0
0
0
0
1
0
1
0
1
57
149
1
999
0
1.1
93.994
-36.4
4.857
5191.0
...
0
1
0
0
0
0
1
0
1
0
2
37
226
1
999
0
1.1
93.994
-36.4
4.857
5191.0
...
0
1
0
0
0
0
1
0
1
0
3
40
151
1
999
0
1.1
93.994
-36.4
4.857
5191.0
...
0
1
0
0
0
0
1
0
1
0
4
56
307
1
999
0
1.1
93.994
-36.4
4.857
5191.0
...
0
1
0
0
0
0
1
0
1
0
...
...
...
...
...
...
...
...
...
...
...
...
...
...
...
...
...
...
...
...
...
...
41183
73
334
1
999
0
-1.1
94.767
-50.8
1.028
4963.6
...
1
0
0
0
0
0
1
0
0
1
41184
46
383
1
999
0
-1.1
94.767
-50.8
1.028
4963.6
...
1
0
0
0
0
0
1
0
1
0
41185
56
189
2
999
0
-1.1
94.767
-50.8
1.028
4963.6
...
1
0
0
0
0
0
1
0
1
0
41186
44
442
1
999
0
-1.1
94.767
-50.8
1.028
4963.6
...
1
0
0
0
0
0
1
0
0
1
41187
74
239
3
999
1
-1.1
94.767
-50.8
1.028
4963.6
...
1
0
0
0
0
1
0
0
1
0
41188 rows × 65 columnsfrom sklearn.preprocessing import StandardScalerscaler = StandardScaler()scaled_X = scaler.fit_transform(X)Creating and Fitting a KMeans Model
Note of our method choices here:
- fit(X[, y, sample_weight])
- Compute k-means clustering.
- fit_predict(X[, y, sample_weight])
- Compute cluster centers and predict cluster index for each sample.
- fit_transform(X[, y, sample_weight])
- Compute clustering and transform X to cluster-distance space.
- predict(X[, sample_weight])
- Predict the closest cluster each sample in X belongs to.
from sklearn.cluster import KMeansmodel = KMeans(n_clusters=2)# Make sure to watch video to understand this line and fit() vs transform()
cluster_labels = model.fit_predict(scaled_X)# IMPORTANT NOTE: YOUR 0s and 1s may be opposite of ours,
# makes sense, the number values are not significant!
cluster_labelsarray([0, 0, 0, ..., 1, 1, 1])len(scaled_X)41188len(cluster_labels)41188X['Cluster'] = cluster_labelssns.heatmap(X.corr())<AxesSubplot:>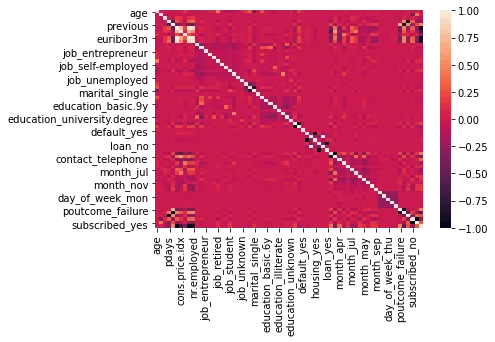
X.corr()['Cluster']age -0.019767
duration 0.039581
campaign -0.129103
pdays -0.267714
previous 0.4784937 more lines
                          ...
poutcome_nonexistent   -0.544406
poutcome_success        0.254406
subscribed_no          -0.294472
subscribed_yes          0.294472
Cluster                 1.000000
Name: Cluster, Length: 66, dtype: float64plt.figure(figsize=(12,6),dpi=200)
X.corr()['Cluster'].iloc[:-1].sort_values().plot(kind='bar')<AxesSubplot:>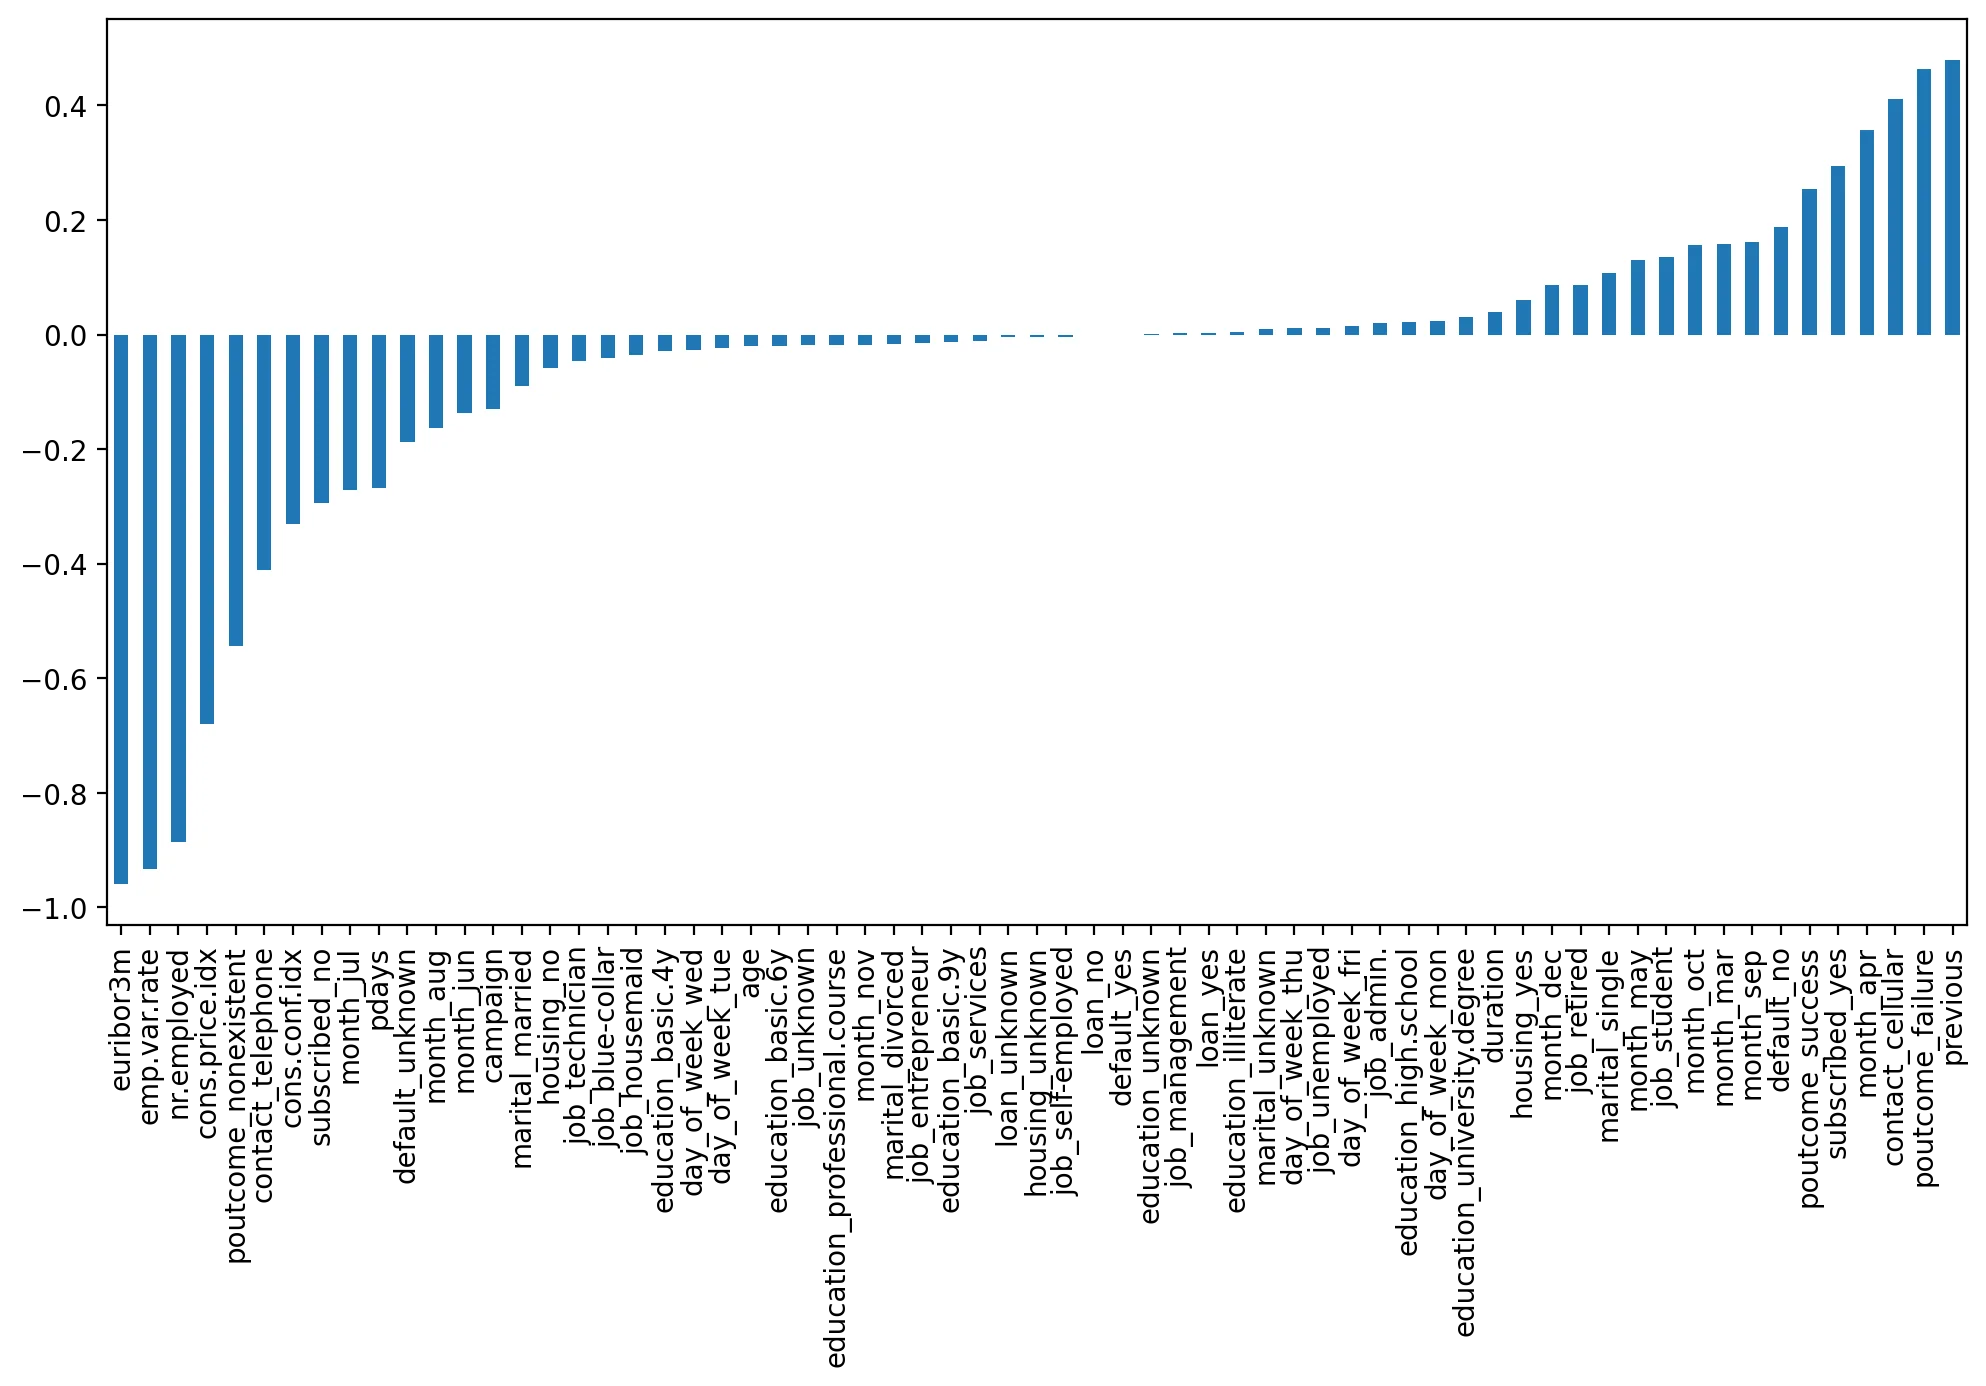
Choosing K Value
ssd = []

for k in range(2,10):

    model = KMeans(n_clusters=k)


    model.fit(scaled_X)

    #Sum of squared distances of samples to their closest cluster center.
ssd.append(model.inertia_)plt.plot(range(2,10),ssd,'o--')
plt.xlabel("K Value")
plt.ylabel(" Sum of Squared Distances")Text(0, 0.5, ' Sum of Squared Distances')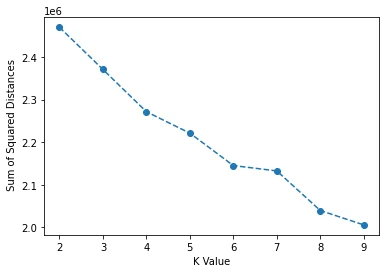
Analyzing SSE Reduction
ssd[2469792.4095956706,
2370787.709348152,
2271502.7007717513,
2221128.900236805,
2145067.141554143,3 more lines
 2132468.751266735,
 2039460.8832193925,
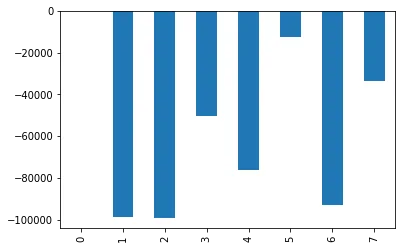
2005692.7454239195]# Change in SSD from previous K value!
pd.Series(ssd).diff()0 NaN
1 -99004.700248
2 -99285.008576
3 -50373.800535
4 -76061.7586834 more lines
5   -12598.390287
6   -93007.868047
7   -33768.137795
dtype: float64pd.Series(ssd).diff().plot(kind='bar')<AxesSubplot:>