NLP and Supervised Learning
Classification of Text Data
The Data
Source: https://www.kaggle.com/crowdflower/twitter-airline-sentiment?select=Tweets.csv
This data originally came from Crowdflower's Data for Everyone library.
As the original source says,
A sentiment analysis job about the problems of each major U.S. airline. Twitter data was scraped from February of 2015 and contributors were asked to first classify positive, negative, and neutral tweets, followed by categorizing negative reasons (such as "late flight" or "rude service").
The Goal: Create a Machine Learning Algorithm that can predict if a tweet is positive, neutral, or negative. In the future we could use such an algorithm to automatically read and flag tweets for an airline for a customer service agent to reach out to contact.
df = pd.read_csv("../DATA/airline_tweets.csv")df.head()tweet_id
airline_sentiment
airline_sentiment_confidence
negativereason
negativereason_confidence90 more lines
airline
airline_sentiment_gold
name
negativereason_gold
retweet_count
text
tweet_coord
tweet_created
tweet_location
user_timezone
0
570306133677760513
neutral
1.0000
NaN
NaN
Virgin America
NaN
cairdin
NaN
0
@VirginAmerica What @dhepburn said.
NaN
2015-02-24 11:35:52 -0800
NaN
Eastern Time (US & Canada)
1
570301130888122368
positive
0.3486
NaN
0.0000
Virgin America
NaN
jnardino
NaN
0
@VirginAmerica plus you've added commercials t...
NaN
2015-02-24 11:15:59 -0800
NaN
Pacific Time (US & Canada)
2
570301083672813571
neutral
0.6837
NaN
NaN
Virgin America
NaN
yvonnalynn
NaN
0
@VirginAmerica I didn't today... Must mean I n...
NaN
2015-02-24 11:15:48 -0800
Lets Play
Central Time (US & Canada)
3
570301031407624196
negative
1.0000
Bad Flight
0.7033
Virgin America
NaN
jnardino
NaN
0
@VirginAmerica it's really aggressive to blast...
NaN
2015-02-24 11:15:36 -0800
NaN
Pacific Time (US & Canada)
4
570300817074462722
negative
1.0000
Can't Tell
1.0000
Virgin America
NaN
jnardino
NaN
0
@VirginAmerica and it's a really big bad thing...
NaN
2015-02-24 11:14:45 -0800
NaN
Pacific Time (US & Canada)sns.countplot(data=df,x='airline',hue='airline_sentiment')<AxesSubplot:xlabel='airline', ylabel='count'>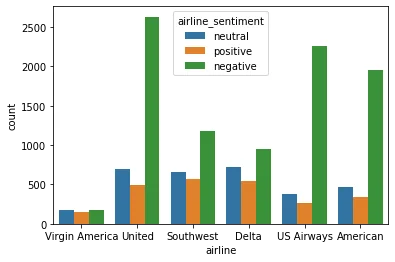
sns.countplot(data=df,x='negativereason')
plt.xticks(rotation=90);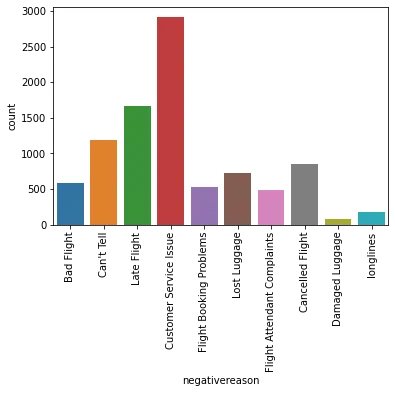
sns.countplot(data=df,x='airline_sentiment')<AxesSubplot:xlabel='airline_sentiment', ylabel='count'>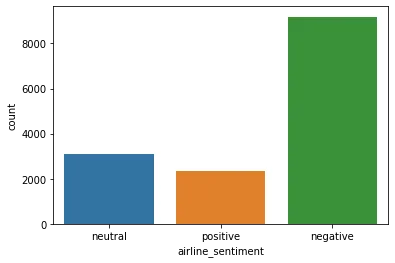
df['airline_sentiment'].value_counts()negative 9178
neutral 3099
positive 2363
Name: airline_sentiment, dtype: int64Features and Label
data = df[['airline_sentiment','text']]data.head()airline_sentiment
text
0
neutral
@VirginAmerica What @dhepburn said.12 more lines
1
positive
@VirginAmerica plus you've added commercials t...
2
neutral
@VirginAmerica I didn't today... Must mean I n...
3
negative
@VirginAmerica it's really aggressive to blast...
4
negative
@VirginAmerica and it's a really big bad thing...y = df['airline_sentiment']
X = df['text']Train Test Split
from sklearn.model_selection import train_test_splitX_train, X_test, y_train, y_test = train_test_split(X, y, test_size=0.2, random_state=101)Vectorization
from sklearn.feature_extraction.text import TfidfVectorizertfidf = TfidfVectorizer(stop_words='english')tfidf.fit(X_train)TfidfVectorizer(stop_words='english')X_train_tfidf = tfidf.transform(X_train)
X_test_tfidf = tfidf.transform(X_test)X_train_tfidf<11712x12971 sparse matrix of type '<class 'numpy.float64'>'
with 107073 stored elements in Compressed Sparse Row format>DO NOT USE .todense() for such a large sparse matrix!!!
Model Comparisons - Naive Bayes,LogisticRegression, LinearSVC
from sklearn.naive_bayes import MultinomialNB
nb = MultinomialNB()
nb.fit(X_train_tfidf,y_train)MultinomialNB()from sklearn.linear_model import LogisticRegression
log = LogisticRegression(max_iter=1000)
log.fit(X_train_tfidf,y_train)LogisticRegression(max_iter=1000)from sklearn.svm import LinearSVC
svc = LinearSVC()
svc.fit(X_train_tfidf,y_train)LinearSVC()Performance Evaluation
from sklearn.metrics import plot_confusion_matrix,classification_reportdef report(model):
preds = model.predict(X_test_tfidf)
print(classification_report(y_test,preds))
plot_confusion_matrix(model,X_test_tfidf,y_test)print("NB MODEL")
report(nb)NB MODEL
precision recall f1-score support
negative 0.66 0.99 0.79 1817
neutral 0.79 0.15 0.26 6285 more lines
    positive       0.89      0.14      0.24       483

    accuracy                           0.67      2928
   macro avg       0.78      0.43      0.43      2928
weighted avg       0.73      0.67      0.59      2928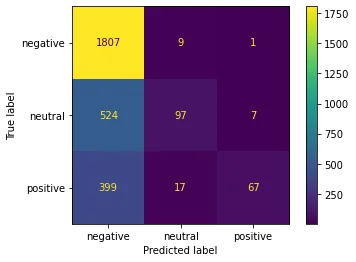
print("Logistic Regression")
report(log)Logistic Regression
precision recall f1-score support
negative 0.80 0.93 0.86 1817
neutral 0.63 0.47 0.54 6285 more lines
    positive       0.82      0.58      0.68       483

    accuracy                           0.77      2928
   macro avg       0.75      0.66      0.69      2928
weighted avg       0.77      0.77      0.76      2928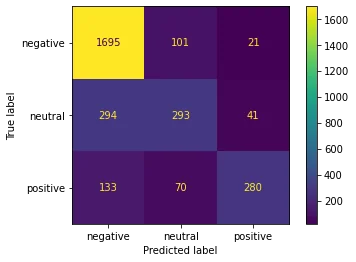
print('SVC')
report(svc)SVC
precision recall f1-score support
negative 0.82 0.89 0.86 1817
neutral 0.59 0.52 0.55 6285 more lines
    positive       0.76      0.64      0.69       483

    accuracy                           0.77      2928
   macro avg       0.73      0.68      0.70      2928
weighted avg       0.76      0.77      0.77      2928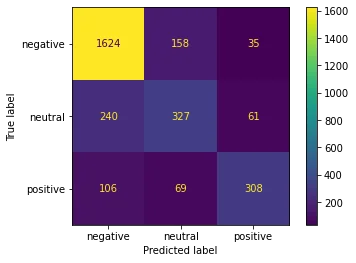
Finalizing a PipeLine for Deployment on New Tweets
If we were satisfied with a model's performance, we should set up a pipeline that can take in a tweet directly.
from sklearn.pipeline import Pipelinepipe = Pipeline([('tfidf',TfidfVectorizer()),('svc',LinearSVC())])pipe.fit(df['text'],df['airline_sentiment'])Pipeline(steps=[('tfidf', TfidfVectorizer()), ('svc', LinearSVC())])new_tweet = ['good flight']
pipe.predict(new_tweet)array(['positive'], dtype=object)new_tweet = ['bad flight']
pipe.predict(new_tweet)array(['negative'], dtype=object)new_tweet = ['ok flight']
pipe.predict(new_tweet)array(['neutral'], dtype=object)