Dealing with Missing Data
We already reviewed Pandas operations for missing data, now let's apply this to clean a real data file. Keep in mind, there is no 100% correct way of doing this, and this notebook just serves as an example of some reasonable approaches to take on this data.
Note: Throughout this section we will be slowly cleaning and adding features to the Ames Housing Dataset for use in the next section. Make sure to always be loading the same file name as in the notebook.
2nd Note: Some of the methods shown here may not lead to optimal performance, but instead are shown to display examples of various methods available.
Imports
with open('../DATA/Ames_Housing_Feature_Description.txt','r') as f:
print(f.read())MSSubClass: Identifies the type of dwelling involved in the sale.
20 1-STORY 1946 & NEWER ALL STYLES
30 1-STORY 1945 & OLDER
40 1-STORY W/FINISHED ATTIC ALL AGES518 more lines
        45	1-1/2 STORY - UNFINISHED ALL AGES
        50	1-1/2 STORY FINISHED ALL AGES
        60	2-STORY 1946 & NEWER
        70	2-STORY 1945 & OLDER
        75	2-1/2 STORY ALL AGES
        80	SPLIT OR MULTI-LEVEL
        85	SPLIT FOYER
        90	DUPLEX - ALL STYLES AND AGES
       120	1-STORY PUD (Planned Unit Development) - 1946 & NEWER
       150	1-1/2 STORY PUD - ALL AGES
       160	2-STORY PUD - 1946 & NEWER
       180	PUD - MULTILEVEL - INCL SPLIT LEV/FOYER
       190	2 FAMILY CONVERSION - ALL STYLES AND AGES

MSZoning: Identifies the general zoning classification of the sale.

       A	Agriculture
       C	Commercial
       FV	Floating Village Residential
       I	Industrial
       RH	Residential High Density
       RL	Residential Low Density
       RP	Residential Low Density Park
       RM	Residential Medium Density

LotFrontage: Linear feet of street connected to property

LotArea: Lot size in square feet

Street: Type of road access to property

       Grvl	Gravel
       Pave	Paved

Alley: Type of alley access to property

       Grvl	Gravel
       Pave	Paved
       NA 	No alley access

LotShape: General shape of property

       Reg	Regular
       IR1	Slightly irregular
       IR2	Moderately Irregular
       IR3	Irregular

LandContour: Flatness of the property

       Lvl	Near Flat/Level
       Bnk	Banked - Quick and significant rise from street grade to building
       HLS	Hillside - Significant slope from side to side
       Low	Depression

Utilities: Type of utilities available

       AllPub	All public Utilities (E,G,W,& S)
       NoSewr	Electricity, Gas, and Water (Septic Tank)
       NoSeWa	Electricity and Gas Only
       ELO	Electricity only

LotConfig: Lot configuration

       Inside	Inside lot
       Corner	Corner lot
       CulDSac	Cul-de-sac
       FR2	Frontage on 2 sides of property
       FR3	Frontage on 3 sides of property

LandSlope: Slope of property

       Gtl	Gentle slope
       Mod	Moderate Slope
       Sev	Severe Slope

Neighborhood: Physical locations within Ames city limits

       Blmngtn	Bloomington Heights
       Blueste	Bluestem
       BrDale	Briardale
       BrkSide	Brookside
       ClearCr	Clear Creek
       CollgCr	College Creek
       Crawfor	Crawford
       Edwards	Edwards
       Gilbert	Gilbert
       IDOTRR	Iowa DOT and Rail Road
       MeadowV	Meadow Village
       Mitchel	Mitchell
       Names	North Ames
       NoRidge	Northridge
       NPkVill	Northpark Villa
       NridgHt	Northridge Heights
       NWAmes	Northwest Ames
       OldTown	Old Town
       SWISU	South & West of Iowa State University
       Sawyer	Sawyer
       SawyerW	Sawyer West
       Somerst	Somerset
       StoneBr	Stone Brook
       Timber	Timberland
       Veenker	Veenker

Condition1: Proximity to various conditions

       Artery	Adjacent to arterial street
       Feedr	Adjacent to feeder street
       Norm	Normal
       RRNn	Within 200' of North-South Railroad
       RRAn	Adjacent to North-South Railroad
       PosN	Near positive off-site feature--park, greenbelt, etc.
       PosA	Adjacent to postive off-site feature
       RRNe	Within 200' of East-West Railroad
       RRAe	Adjacent to East-West Railroad

Condition2: Proximity to various conditions (if more than one is present)

       Artery	Adjacent to arterial street
       Feedr	Adjacent to feeder street
       Norm	Normal
       RRNn	Within 200' of North-South Railroad
       RRAn	Adjacent to North-South Railroad
       PosN	Near positive off-site feature--park, greenbelt, etc.
       PosA	Adjacent to postive off-site feature
       RRNe	Within 200' of East-West Railroad
       RRAe	Adjacent to East-West Railroad

BldgType: Type of dwelling

       1Fam	Single-family Detached
       2FmCon	Two-family Conversion; originally built as one-family dwelling
       Duplx	Duplex
       TwnhsE	Townhouse End Unit
       TwnhsI	Townhouse Inside Unit

HouseStyle: Style of dwelling

       1Story	One story
       1.5Fin	One and one-half story: 2nd level finished
       1.5Unf	One and one-half story: 2nd level unfinished
       2Story	Two story
       2.5Fin	Two and one-half story: 2nd level finished
       2.5Unf	Two and one-half story: 2nd level unfinished
       SFoyer	Split Foyer
       SLvl	Split Level

OverallQual: Rates the overall material and finish of the house

       10	Very Excellent
       9	Excellent
       8	Very Good
       7	Good
       6	Above Average
       5	Average
       4	Below Average
       3	Fair
       2	Poor
       1	Very Poor

OverallCond: Rates the overall condition of the house

       10	Very Excellent
       9	Excellent
       8	Very Good
       7	Good
       6	Above Average
       5	Average
       4	Below Average
       3	Fair
       2	Poor
       1	Very Poor

YearBuilt: Original construction date

YearRemodAdd: Remodel date (same as construction date if no remodeling or additions)

RoofStyle: Type of roof

       Flat	Flat
       Gable	Gable
       Gambrel	Gabrel (Barn)
       Hip	Hip
       Mansard	Mansard
       Shed	Shed

RoofMatl: Roof material

       ClyTile	Clay or Tile
       CompShg	Standard (Composite) Shingle
       Membran	Membrane
       Metal	Metal
       Roll	Roll
       Tar&Grv	Gravel & Tar
       WdShake	Wood Shakes
       WdShngl	Wood Shingles

Exterior1st: Exterior covering on house

       AsbShng	Asbestos Shingles
       AsphShn	Asphalt Shingles
       BrkComm	Brick Common
       BrkFace	Brick Face
       CBlock	Cinder Block
       CemntBd	Cement Board
       HdBoard	Hard Board
       ImStucc	Imitation Stucco
       MetalSd	Metal Siding
       Other	Other
       Plywood	Plywood
       PreCast	PreCast
       Stone	Stone
       Stucco	Stucco
       VinylSd	Vinyl Siding
       Wd Sdng	Wood Siding
       WdShing	Wood Shingles

Exterior2nd: Exterior covering on house (if more than one material)

       AsbShng	Asbestos Shingles
       AsphShn	Asphalt Shingles
       BrkComm	Brick Common
       BrkFace	Brick Face
       CBlock	Cinder Block
       CemntBd	Cement Board
       HdBoard	Hard Board
       ImStucc	Imitation Stucco
       MetalSd	Metal Siding
       Other	Other
       Plywood	Plywood
       PreCast	PreCast
       Stone	Stone
       Stucco	Stucco
       VinylSd	Vinyl Siding
       Wd Sdng	Wood Siding
       WdShing	Wood Shingles

MasVnrType: Masonry veneer type

       BrkCmn	Brick Common
       BrkFace	Brick Face
       CBlock	Cinder Block
       None	None
       Stone	Stone

MasVnrArea: Masonry veneer area in square feet

ExterQual: Evaluates the quality of the material on the exterior

       Ex	Excellent
       Gd	Good
       TA	Average/Typical
       Fa	Fair
       Po	Poor

ExterCond: Evaluates the present condition of the material on the exterior

       Ex	Excellent
       Gd	Good
       TA	Average/Typical
       Fa	Fair
       Po	Poor

Foundation: Type of foundation

       BrkTil	Brick & Tile
       CBlock	Cinder Block
       PConc	Poured Contrete
       Slab	Slab
       Stone	Stone
       Wood	Wood

BsmtQual: Evaluates the height of the basement

       Ex	Excellent (100+ inches)
       Gd	Good (90-99 inches)
       TA	Typical (80-89 inches)
       Fa	Fair (70-79 inches)
       Po	Poor (<70 inches
       NA	No Basement

BsmtCond: Evaluates the general condition of the basement

       Ex	Excellent
       Gd	Good
       TA	Typical - slight dampness allowed
       Fa	Fair - dampness or some cracking or settling
       Po	Poor - Severe cracking, settling, or wetness
       NA	No Basement

BsmtExposure: Refers to walkout or garden level walls

       Gd	Good Exposure
       Av	Average Exposure (split levels or foyers typically score average or above)
       Mn	Mimimum Exposure
       No	No Exposure
       NA	No Basement

BsmtFinType1: Rating of basement finished area

       GLQ	Good Living Quarters
       ALQ	Average Living Quarters
       BLQ	Below Average Living Quarters
       Rec	Average Rec Room
       LwQ	Low Quality
       Unf	Unfinshed
       NA	No Basement

BsmtFinSF1: Type 1 finished square feet

BsmtFinType2: Rating of basement finished area (if multiple types)

       GLQ	Good Living Quarters
       ALQ	Average Living Quarters
       BLQ	Below Average Living Quarters
       Rec	Average Rec Room
       LwQ	Low Quality
       Unf	Unfinshed
       NA	No Basement

BsmtFinSF2: Type 2 finished square feet

BsmtUnfSF: Unfinished square feet of basement area

TotalBsmtSF: Total square feet of basement area

Heating: Type of heating

       Floor	Floor Furnace
       GasA	Gas forced warm air furnace
       GasW	Gas hot water or steam heat
       Grav	Gravity furnace
       OthW	Hot water or steam heat other than gas
       Wall	Wall furnace

HeatingQC: Heating quality and condition

       Ex	Excellent
       Gd	Good
       TA	Average/Typical
       Fa	Fair
       Po	Poor

CentralAir: Central air conditioning

       N	No
       Y	Yes

Electrical: Electrical system

       SBrkr	Standard Circuit Breakers & Romex
       FuseA	Fuse Box over 60 AMP and all Romex wiring (Average)
       FuseF	60 AMP Fuse Box and mostly Romex wiring (Fair)
       FuseP	60 AMP Fuse Box and mostly knob & tube wiring (poor)
       Mix	Mixed

1stFlrSF: First Floor square feet

2ndFlrSF: Second floor square feet

LowQualFinSF: Low quality finished square feet (all floors)

GrLivArea: Above grade (ground) living area square feet

BsmtFullBath: Basement full bathrooms

BsmtHalfBath: Basement half bathrooms

FullBath: Full bathrooms above grade

HalfBath: Half baths above grade

Bedroom: Bedrooms above grade (does NOT include basement bedrooms)

Kitchen: Kitchens above grade

KitchenQual: Kitchen quality

       Ex	Excellent
       Gd	Good
       TA	Typical/Average
       Fa	Fair
       Po	Poor

TotRmsAbvGrd: Total rooms above grade (does not include bathrooms)

Functional: Home functionality (Assume typical unless deductions are warranted)

       Typ	Typical Functionality
       Min1	Minor Deductions 1
       Min2	Minor Deductions 2
       Mod	Moderate Deductions
       Maj1	Major Deductions 1
       Maj2	Major Deductions 2
       Sev	Severely Damaged
       Sal	Salvage only

Fireplaces: Number of fireplaces

FireplaceQu: Fireplace quality

       Ex	Excellent - Exceptional Masonry Fireplace
       Gd	Good - Masonry Fireplace in main level
       TA	Average - Prefabricated Fireplace in main living area or Masonry Fireplace in basement
       Fa	Fair - Prefabricated Fireplace in basement
       Po	Poor - Ben Franklin Stove
       NA	No Fireplace

GarageType: Garage location

       2Types	More than one type of garage
       Attchd	Attached to home
       Basment	Basement Garage
       BuiltIn	Built-In (Garage part of house - typically has room above garage)
       CarPort	Car Port
       Detchd	Detached from home
       NA	No Garage

GarageYrBlt: Year garage was built

GarageFinish: Interior finish of the garage

       Fin	Finished
       RFn	Rough Finished
       Unf	Unfinished
       NA	No Garage

GarageCars: Size of garage in car capacity

GarageArea: Size of garage in square feet

GarageQual: Garage quality

       Ex	Excellent
       Gd	Good
       TA	Typical/Average
       Fa	Fair
       Po	Poor
       NA	No Garage

GarageCond: Garage condition

       Ex	Excellent
       Gd	Good
       TA	Typical/Average
       Fa	Fair
       Po	Poor
       NA	No Garage

PavedDrive: Paved driveway

       Y	Paved
       P	Partial Pavement
       N	Dirt/Gravel

WoodDeckSF: Wood deck area in square feet

OpenPorchSF: Open porch area in square feet

EnclosedPorch: Enclosed porch area in square feet

3SsnPorch: Three season porch area in square feet

ScreenPorch: Screen porch area in square feet

PoolArea: Pool area in square feet

PoolQC: Pool quality

       Ex	Excellent
       Gd	Good
       TA	Average/Typical
       Fa	Fair
       NA	No Pool

Fence: Fence quality

       GdPrv	Good Privacy
       MnPrv	Minimum Privacy
       GdWo	Good Wood
       MnWw	Minimum Wood/Wire
       NA	No Fence

MiscFeature: Miscellaneous feature not covered in other categories

       Elev	Elevator
       Gar2	2nd Garage (if not described in garage section)
       Othr	Other
       Shed	Shed (over 100 SF)
       TenC	Tennis Court
       NA	None

MiscVal: $Value of miscellaneous feature

MoSold: Month Sold (MM)

YrSold: Year Sold (YYYY)

SaleType: Type of sale

       WD 	Warranty Deed - Conventional
       CWD	Warranty Deed - Cash
       VWD	Warranty Deed - VA Loan
       New	Home just constructed and sold
       COD	Court Officer Deed/Estate
       Con	Contract 15% Down payment regular terms
       ConLw	Contract Low Down payment and low interest
       ConLI	Contract Low Interest
       ConLD	Contract Low Down
       Oth	Other

SaleCondition: Condition of sale

       Normal	Normal Sale
       Abnorml	Abnormal Sale -  trade, foreclosure, short sale
       AdjLand	Adjoining Land Purchase
       Alloca	Allocation - two linked properties with separate deeds, typically condo with a garage unit
       Family	Sale between family members
       Partial	Home was not completed when last assessed (associated with New Homes)
Data
df = pd.read_csv("../DATA/Ames_outliers_removed.csv")df.head()PID
MS SubClass
MS Zoning
Lot Frontage
Lot Area127 more lines
Street
Alley
Lot Shape
Land Contour
Utilities
...
Pool Area
Pool QC
Fence
Misc Feature
Misc Val
Mo Sold
Yr Sold
Sale Type
Sale Condition
SalePrice
0
526301100
20
RL
141.0
31770
Pave
NaN
IR1
Lvl
AllPub
...
0
NaN
NaN
NaN
0
5
2010
WD
Normal
215000
1
526350040
20
RH
80.0
11622
Pave
NaN
Reg
Lvl
AllPub
...
0
NaN
MnPrv
NaN
0
6
2010
WD
Normal
105000
2
526351010
20
RL
81.0
14267
Pave
NaN
IR1
Lvl
AllPub
...
0
NaN
NaN
Gar2
12500
6
2010
WD
Normal
172000
3
526353030
20
RL
93.0
11160
Pave
NaN
Reg
Lvl
AllPub
...
0
NaN
NaN
NaN
0
4
2010
WD
Normal
244000
4
527105010
60
RL
74.0
13830
Pave
NaN
IR1
Lvl
AllPub
...
0
NaN
MnPrv
NaN
0
3
2010
WD
Normal
189900
5 rows × 81 columnslen(df.columns)81df.info()<class 'pandas.core.frame.DataFrame'>
RangeIndex: 2927 entries, 0 to 2926
Data columns (total 81 columns):
# Column Non-Null Count Dtype
--- ------ -------------- ----- 83 more lines
 0   PID              2927 non-null   int64
 1   MS SubClass      2927 non-null   int64
 2   MS Zoning        2927 non-null   object
 3   Lot Frontage     2437 non-null   float64
 4   Lot Area         2927 non-null   int64
 5   Street           2927 non-null   object
 6   Alley            198 non-null    object
 7   Lot Shape        2927 non-null   object
 8   Land Contour     2927 non-null   object
 9   Utilities        2927 non-null   object
 10  Lot Config       2927 non-null   object
 11  Land Slope       2927 non-null   object
 12  Neighborhood     2927 non-null   object
 13  Condition 1      2927 non-null   object
 14  Condition 2      2927 non-null   object
 15  Bldg Type        2927 non-null   object
 16  House Style      2927 non-null   object
 17  Overall Qual     2927 non-null   int64
 18  Overall Cond     2927 non-null   int64
 19  Year Built       2927 non-null   int64
 20  Year Remod/Add   2927 non-null   int64
 21  Roof Style       2927 non-null   object
 22  Roof Matl        2927 non-null   object
 23  Exterior 1st     2927 non-null   object
 24  Exterior 2nd     2927 non-null   object
 25  Mas Vnr Type     2904 non-null   object
 26  Mas Vnr Area     2904 non-null   float64
 27  Exter Qual       2927 non-null   object
 28  Exter Cond       2927 non-null   object
 29  Foundation       2927 non-null   object
 30  Bsmt Qual        2847 non-null   object
 31  Bsmt Cond        2847 non-null   object
 32  Bsmt Exposure    2844 non-null   object
 33  BsmtFin Type 1   2847 non-null   object
 34  BsmtFin SF 1     2926 non-null   float64
 35  BsmtFin Type 2   2846 non-null   object
 36  BsmtFin SF 2     2926 non-null   float64
 37  Bsmt Unf SF      2926 non-null   float64
 38  Total Bsmt SF    2926 non-null   float64
 39  Heating          2927 non-null   object
 40  Heating QC       2927 non-null   object
 41  Central Air      2927 non-null   object
 42  Electrical       2926 non-null   object
 43  1st Flr SF       2927 non-null   int64
 44  2nd Flr SF       2927 non-null   int64
 45  Low Qual Fin SF  2927 non-null   int64
 46  Gr Liv Area      2927 non-null   int64
 47  Bsmt Full Bath   2925 non-null   float64
 48  Bsmt Half Bath   2925 non-null   float64
 49  Full Bath        2927 non-null   int64
 50  Half Bath        2927 non-null   int64
 51  Bedroom AbvGr    2927 non-null   int64
 52  Kitchen AbvGr    2927 non-null   int64
 53  Kitchen Qual     2927 non-null   object
 54  TotRms AbvGrd    2927 non-null   int64
 55  Functional       2927 non-null   object
 56  Fireplaces       2927 non-null   int64
 57  Fireplace Qu     1505 non-null   object
 58  Garage Type      2770 non-null   object
 59  Garage Yr Blt    2768 non-null   float64
 60  Garage Finish    2768 non-null   object
 61  Garage Cars      2926 non-null   float64
 62  Garage Area      2926 non-null   float64
 63  Garage Qual      2768 non-null   object
 64  Garage Cond      2768 non-null   object
 65  Paved Drive      2927 non-null   object
 66  Wood Deck SF     2927 non-null   int64
 67  Open Porch SF    2927 non-null   int64
 68  Enclosed Porch   2927 non-null   int64
 69  3Ssn Porch       2927 non-null   int64
 70  Screen Porch     2927 non-null   int64
 71  Pool Area        2927 non-null   int64
 72  Pool QC          12 non-null     object
 73  Fence            572 non-null    object
 74  Misc Feature     105 non-null    object
 75  Misc Val         2927 non-null   int64
 76  Mo Sold          2927 non-null   int64
 77  Yr Sold          2927 non-null   int64
 78  Sale Type        2927 non-null   object
 79  Sale Condition   2927 non-null   object
 80  SalePrice        2927 non-null   int64
dtypes: float64(11), int64(27), object(43)
memory usage: 1.8+ MB
Removing the PID
We already have an index, so we don't need the PID unique identifier for the regression we will perform later on.
df = df.drop('PID',axis=1)len(df.columns)80Observing NaN Features
df.isnull()MS SubClass
MS Zoning
Lot Frontage
Lot Area
Street259 more lines
Alley
Lot Shape
Land Contour
Utilities
Lot Config
...
Pool Area
Pool QC
Fence
Misc Feature
Misc Val
Mo Sold
Yr Sold
Sale Type
Sale Condition
SalePrice
0
False
False
False
False
False
True
False
False
False
False
...
False
True
True
True
False
False
False
False
False
False
1
False
False
False
False
False
True
False
False
False
False
...
False
True
False
True
False
False
False
False
False
False
2
False
False
False
False
False
True
False
False
False
False
...
False
True
True
False
False
False
False
False
False
False
3
False
False
False
False
False
True
False
False
False
False
...
False
True
True
True
False
False
False
False
False
False
4
False
False
False
False
False
True
False
False
False
False
...
False
True
False
True
False
False
False
False
False
False
...
...
...
...
...
...
...
...
...
...
...
...
...
...
...
...
...
...
...
...
...
...
2922
False
False
False
False
False
True
False
False
False
False
...
False
True
False
True
False
False
False
False
False
False
2923
False
False
True
False
False
True
False
False
False
False
...
False
True
False
True
False
False
False
False
False
False
2924
False
False
False
False
False
True
False
False
False
False
...
False
True
False
False
False
False
False
False
False
False
2925
False
False
False
False
False
True
False
False
False
False
...
False
True
True
True
False
False
False
False
False
False
2926
False
False
False
False
False
True
False
False
False
False
...
False
True
True
True
False
False
False
False
False
False
2927 rows × 80 columnsdf.isnull().sum()MS SubClass 0
MS Zoning 0
Lot Frontage 490
Lot Area 0
Street 07 more lines
                 ...
Mo Sold             0
Yr Sold             0
Sale Type           0
Sale Condition      0
SalePrice           0
Length: 80, dtype: int64100* df.isnull().sum() / len(df)MS SubClass 0.00000
MS Zoning 0.00000
Lot Frontage 16.74069
Lot Area 0.00000
Street 0.000007 more lines
                    ...
Mo Sold            0.00000
Yr Sold            0.00000
Sale Type          0.00000
Sale Condition     0.00000
SalePrice          0.00000
Length: 80, dtype: float64def percent_missing(df):
percent_nan = 100* df.isnull().sum() / len(df)
percent_nan = percent_nan[percent_nan>0].sort_values()
return percent_nanpercent_nan = percent_missing(df)sns.barplot(x=percent_nan.index,y=percent_nan)
plt.xticks(rotation=90);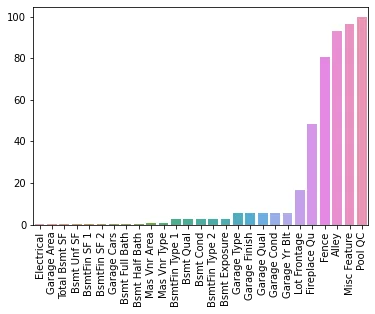
Removing Features or Removing Rows
If only a few rows relative to the size of your dataset are missing some values, then it might just be a good idea to drop those rows. What does this cost you in terms of performace? It essentialy removes potential training/testing data, but if its only a few rows, its unlikely to change performance.
Sometimes it is a good idea to remove a feature entirely if it has too many null values. However, you should carefully consider why it has so many null values, in certain situations null could just be used as a separate category.
Take for example a feature column for the number of cars that can fit into a garage. Perhaps if there is no garage then there is a null value, instead of a zero. It probably makes more sense to quickly fill the null values in this case with a zero instead of a null. Only you can decide based off your domain expertise and knowledge of the data set!
Working based on Rows Missing Data
Filling in Data or Dropping Data?
Let's explore how to choose to remove or fill in missing data for rows that are missing some data. Let's choose some threshold where we decide it is ok to drop a row if its missing some data (instead of attempting to fill in that missing data point). We will choose 1% as our threshold. This means if less than 1% of the rows are missing this feature, we will consider just dropping that row, instead of dealing with the feature itself. There is no right answer here, just use common sense and your domain knowledge of the dataset, obviously you don't want to drop a very high threshold like 50% , you should also explore correlation to the dataset, maybe it makes sense to drop the feature instead.
Based on the text description of the features, you will see that most of this missing data is actually NaN on purpose as a placeholder for 0 or "none".
Example of Filling in Data : Basement Columns
sns.barplot(x=percent_nan.index,y=percent_nan)
plt.xticks(rotation=90);
# Set 1% Threshold
plt.ylim(0,1)(0.0, 1.0)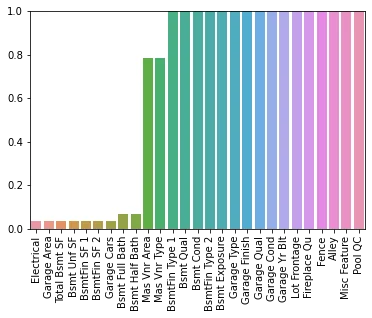
Let's drop or fill the rows based on this data. You could either manually fill in the data (especially the Basement data based on the description text file) OR you could simply drop the row and not consider it. Watch the video for a full explanation of this, in reality it probably makes more sense to fill in the Missing Basement data since its well described in the text description.
# Could also imply we should ex
percent_nan[percent_nan < 1]Electrical 0.034165
Garage Area 0.034165
Total Bsmt SF 0.034165
Bsmt Unf SF 0.034165
BsmtFin SF 1 0.0341657 more lines
BsmtFin SF 2      0.034165
Garage Cars       0.034165
Bsmt Full Bath    0.068329
Bsmt Half Bath    0.068329
Mas Vnr Area      0.785787
Mas Vnr Type      0.785787
dtype: float64100/len(df)0.0341646737273659df[df['Total Bsmt SF'].isnull()]MS SubClass
MS Zoning
Lot Frontage
Lot Area
Street39 more lines
Alley
Lot Shape
Land Contour
Utilities
Lot Config
...
Pool Area
Pool QC
Fence
Misc Feature
Misc Val
Mo Sold
Yr Sold
Sale Type
Sale Condition
SalePrice
1341
20
RM
99.0
5940
Pave
NaN
IR1
Lvl
AllPub
FR3
...
0
NaN
MnPrv
NaN
0
4
2008
ConLD
Abnorml
79000
1 rows × 80 columnsdf[df['Bsmt Half Bath'].isnull()]MS SubClass
MS Zoning
Lot Frontage
Lot Area
Street61 more lines
Alley
Lot Shape
Land Contour
Utilities
Lot Config
...
Pool Area
Pool QC
Fence
Misc Feature
Misc Val
Mo Sold
Yr Sold
Sale Type
Sale Condition
SalePrice
1341
20
RM
99.0
5940
Pave
NaN
IR1
Lvl
AllPub
FR3
...
0
NaN
MnPrv
NaN
0
4
2008
ConLD
Abnorml
79000
1497
20
RL
123.0
47007
Pave
NaN
IR1
Lvl
AllPub
Inside
...
0
NaN
NaN
NaN
0
7
2008
WD
Normal
284700
2 rows × 80 columns
Filling in data based on column names. There are 2 types of basement features, numerical and string descriptives.
The numerical basement columns:
bsmt_num_cols = ['BsmtFin SF 1', 'BsmtFin SF 2', 'Bsmt Unf SF','Total Bsmt SF', 'Bsmt Full Bath', 'Bsmt Half Bath']
df[bsmt_num_cols] = df[bsmt_num_cols].fillna(0)
The string basement columns:
bsmt_str_cols =  ['Bsmt Qual', 'Bsmt Cond', 'Bsmt Exposure', 'BsmtFin Type 1', 'BsmtFin Type 2']
df[bsmt_str_cols] = df[bsmt_str_cols].fillna('None')percent_nan = percent_missing(df)sns.barplot(x=percent_nan.index,y=percent_nan)
plt.xticks(rotation=90);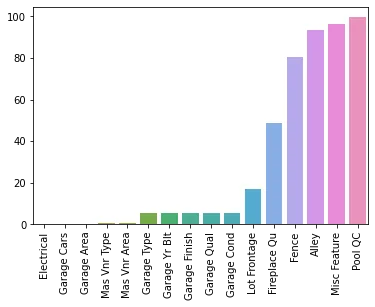
Dropping Rows
A few of these features appear that it is just one or two rows missing the data. Based on our description .txt file of the dataset, we could also fill in these data points easily, and that is the more correct approach, but here we show how to drop in case you find yourself in a situation where it makes more sense to drop a row, based on missing column features.
df.dropna() --- subset : array-like, optional Labels along other axis to consider, e.g. if you are dropping rows these would be a list of columns to include.
df = df.dropna(axis=0,subset= ['Electrical','Garage Cars'])percent_nan = percent_missing(df)sns.barplot(x=percent_nan.index,y=percent_nan)
plt.xticks(rotation=90);
plt.ylim(0,1)(0.0, 1.0)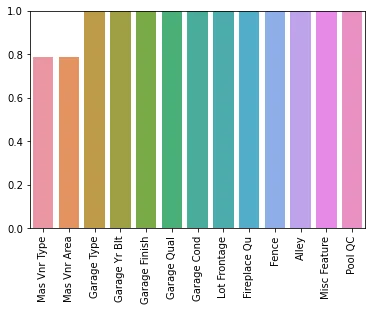
Mas Vnr Feature
Based on the Description Text File, Mas Vnr Type and Mas Vnr Area being missing (NaN) is likely to mean the house simply just doesn't have a masonry veneer, in which case, we will fill in this data as we did before.
df["Mas Vnr Type"] = df["Mas Vnr Type"].fillna("None")
df["Mas Vnr Area"] = df["Mas Vnr Area"].fillna(0)percent_nan = percent_missing(df)sns.barplot(x=percent_nan.index,y=percent_nan)
plt.xticks(rotation=90);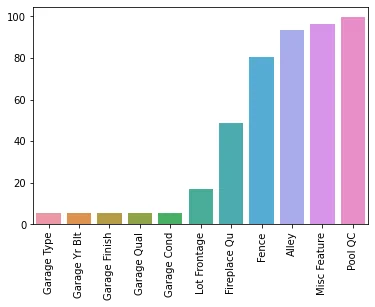
Filling In Missing Column Data
Our previous approaches were based more on rows missing data, now we will take an approach based on the column features themselves, since larger percentages of the data appears to be missing.
Garage Columns
Based on the data description, these NaN seem to indicate no garage, so we will substitute with "None" or 0.
df[['Garage Type', 'Garage Finish', 'Garage Qual', 'Garage Cond']]Garage Type
Garage Finish
Garage Qual
Garage Cond
055 more lines
Attchd
Fin
TA
TA
1
Attchd
Unf
TA
TA
2
Attchd
Unf
TA
TA
3
Attchd
Fin
TA
TA
4
Attchd
Fin
TA
TA
...
...
...
...
...
2922
Detchd
Unf
TA
TA
2923
Attchd
Unf
TA
TA
2924
NaN
NaN
NaN
NaN
2925
Attchd
RFn
TA
TA
2926
Attchd
Fin
TA
TA
2925 rows × 4 columnsgar_str_cols = ['Garage Type', 'Garage Finish', 'Garage Qual', 'Garage Cond']
df[gar_str_cols] = df[gar_str_cols].fillna('None')df['Garage Yr Blt'] = df['Garage Yr Blt'].fillna(0)percent_nan = percent_missing(df)sns.barplot(x=percent_nan.index,y=percent_nan)
plt.xticks(rotation=90);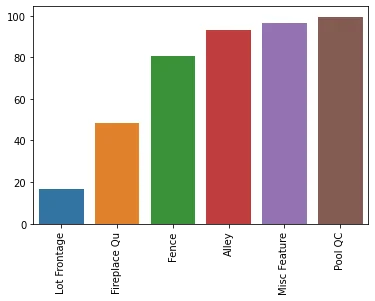
Dropping Feature Columns
Sometimes you may want to take the approach that above a certain missing percentage threshold, you will simply remove the feature from all the data. For example if 99% of rows are missing a feature, it will not be predictive, since almost all the data does not have any value for it. In our particular data set, many of these high percentage NaN features are actually plasceholders for "none" or 0. But for the sake of showing variations on dealing with missing data, we will remove these features, instead of filling them in with the appropriate value.
percent_nan.indexIndex(['Lot Frontage', 'Fireplace Qu', 'Fence', 'Alley', 'Misc Feature',
'Pool QC'],
dtype='object')df[['Lot Frontage', 'Fireplace Qu', 'Fence', 'Alley', 'Misc Feature','Pool QC']]Lot Frontage
Fireplace Qu
Fence
Alley
Misc Feature79 more lines
Pool QC
0
141.0
Gd
NaN
NaN
NaN
NaN
1
80.0
NaN
MnPrv
NaN
NaN
NaN
2
81.0
NaN
NaN
NaN
Gar2
NaN
3
93.0
TA
NaN
NaN
NaN
NaN
4
74.0
TA
MnPrv
NaN
NaN
NaN
...
...
...
...
...
...
...
2922
37.0
NaN
GdPrv
NaN
NaN
NaN
2923
NaN
NaN
MnPrv
NaN
NaN
NaN
2924
62.0
NaN
MnPrv
NaN
Shed
NaN
2925
77.0
TA
NaN
NaN
NaN
NaN
2926
74.0
TA
NaN
NaN
NaN
NaN
2925 rows × 6 columnsdf = df.drop(['Pool QC','Misc Feature','Alley','Fence'],axis=1)percent_nan = percent_missing(df)sns.barplot(x=percent_nan.index,y=percent_nan)
plt.xticks(rotation=90);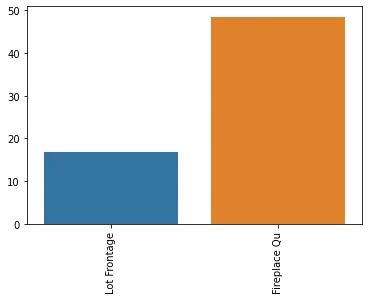
Filling in Fireplace Quality based on Description Text
df['Fireplace Qu'] = df['Fireplace Qu'].fillna("None")percent_nan = percent_missing(df)sns.barplot(x=percent_nan.index,y=percent_nan)
plt.xticks(rotation=90);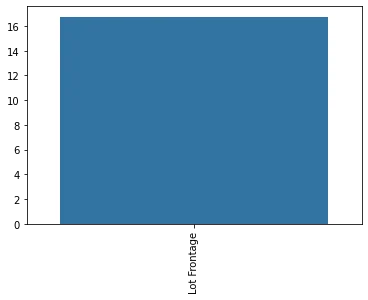
Imputation) of Missing Data
To impute missing data, we need to decide what other filled in (no NaN values) feature most probably relates and is correlated with the missing feature data. In this particular case we will use:
Neighborhood: Physical locations within Ames city limits
LotFrontage: Linear feet of street connected to property
We will operate under the assumption that the Lot Frontage is related to what neighborhood a house is in.
df['Neighborhood'].unique()array(['NAmes', 'Gilbert', 'StoneBr', 'NWAmes', 'Somerst', 'BrDale',
'NPkVill', 'NridgHt', 'Blmngtn', 'NoRidge', 'SawyerW', 'Sawyer',
'Greens', 'BrkSide', 'OldTown', 'IDOTRR', 'ClearCr', 'SWISU',
'Edwards', 'CollgCr', 'Crawfor', 'Blueste', 'Mitchel', 'Timber',
'MeadowV', 'Veenker', 'GrnHill', 'Landmrk'], dtype=object)plt.figure(figsize=(8,12))
sns.boxplot(x='Lot Frontage',y='Neighborhood',data=df,orient='h')<AxesSubplot:xlabel='Lot Frontage', ylabel='Neighborhood'>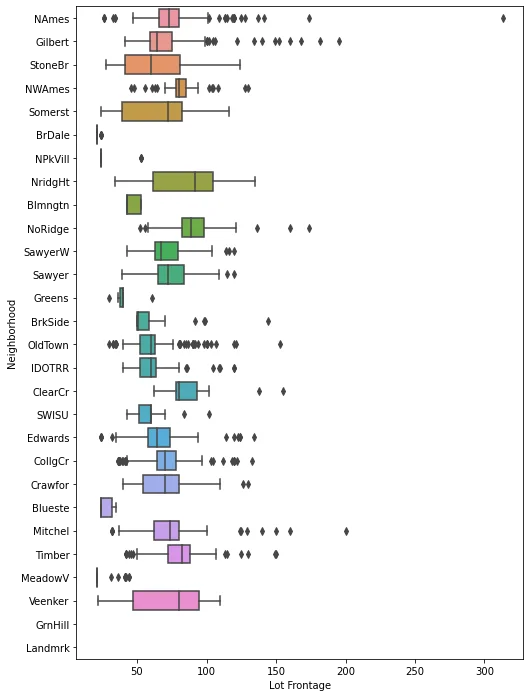
Impute Missing Data based on other Features
There are more complex methods, but usually the simpler the better, it avoids building models on top of other models.
More Info on Options: https://scikit-learn.org/stable/modules/impute.html
df.groupby('Neighborhood')['Lot Frontage']<pandas.core.groupby.generic.SeriesGroupBy object at 0x00000211F18E23C8>df.groupby('Neighborhood')['Lot Frontage'].mean()Neighborhood
Blmngtn 46.900000
Blueste 27.300000
BrDale 21.500000
BrkSide 55.78947425 more lines
ClearCr    88.150000
CollgCr    71.336364
Crawfor    69.951807
Edwards    64.794286
Gilbert    74.207207
Greens     41.000000
GrnHill          NaN
IDOTRR     62.383721
Landmrk          NaN
MeadowV    25.606061
Mitchel    75.144444
NAmes      75.210667
NPkVill    28.142857
NWAmes     81.517647
NoRidge    91.629630
NridgHt    84.184049
OldTown    61.777293
SWISU      59.068182
Sawyer     74.551020
SawyerW    70.669811
Somerst    64.549383
StoneBr    62.173913
Timber     81.303571
Veenker    72.000000
Name: Lot Frontage, dtype: float64
Transform Column
https://pandas.pydata.org/pandas-docs/stable/reference/api/pandas.DataFrame.transform.html
df.head()['Lot Frontage']0 141.0
1 80.0
2 81.0
3 93.0
4 74.01 more line
Name: Lot Frontage, dtype: float64df[df['Lot Frontage'].isnull()]MS SubClass
MS Zoning
Lot Frontage
Lot Area
Street259 more lines
Lot Shape
Land Contour
Utilities
Lot Config
Land Slope
...
Enclosed Porch
3Ssn Porch
Screen Porch
Pool Area
Misc Val
Mo Sold
Yr Sold
Sale Type
Sale Condition
SalePrice
11
20
RL
NaN
7980
Pave
IR1
Lvl
AllPub
Inside
Gtl
...
0
0
0
0
500
3
2010
WD
Normal
185000
14
120
RL
NaN
6820
Pave
IR1
Lvl
AllPub
Corner
Gtl
...
0
0
140
0
0
6
2010
WD
Normal
212000
22
60
FV
NaN
7500
Pave
Reg
Lvl
AllPub
Inside
Gtl
...
0
0
0
0
0
1
2010
WD
Normal
216000
23
20
RL
NaN
11241
Pave
IR1
Lvl
AllPub
CulDSac
Gtl
...
0
0
0
0
700
3
2010
WD
Normal
149000
24
20
RL
NaN
12537
Pave
IR1
Lvl
AllPub
CulDSac
Gtl
...
0
0
0
0
0
4
2010
WD
Normal
149900
...
...
...
...
...
...
...
...
...
...
...
...
...
...
...
...
...
...
...
...
...
...
2891
20
RL
NaN
16669
Pave
IR1
Lvl
AllPub
Corner
Gtl
...
0
0
0
0
0
1
2006
WD
Normal
228000
2894
60
RL
NaN
11170
Pave
IR2
Lvl
AllPub
Corner
Gtl
...
0
0
0
0
0
4
2006
WD
Normal
250000
2895
20
RL
NaN
8098
Pave
IR1
Lvl
AllPub
Inside
Gtl
...
0
0
0
0
0
10
2006
WD
Normal
202000
2909
90
RL
NaN
11836
Pave
IR1
Lvl
AllPub
Corner
Gtl
...
0
0
0
0
0
3
2006
WD
Normal
146500
2923
20
RL
NaN
8885
Pave
IR1
Low
AllPub
Inside
Mod
...
0
0
0
0
0
6
2006
WD
Normal
131000
490 rows × 76 columnsdf.iloc[21:26]['Lot Frontage']21 85.0
22 NaN
23 NaN
24 NaN
25 65.01 more line
Name: Lot Frontage, dtype: float64df.groupby('Neighborhood')['Lot Frontage'].transform(lambda val: val.fillna(val.mean()))0 141.000000
1 80.000000
2 81.000000
3 93.000000
4 74.0000007 more lines
           ...
2922     37.000000
2923     75.144444
2924     62.000000
2925     77.000000
2926     74.000000
Name: Lot Frontage, Length: 2925, dtype: float64df.groupby('Neighborhood')['Lot Frontage'].transform(lambda val: val.fillna(val.mean())).iloc[21:26]21 85.000000
22 64.549383
23 75.210667
24 75.210667
25 65.0000001 more line
Name: Lot Frontage, dtype: float64df['Lot Frontage'] = df.groupby('Neighborhood')['Lot Frontage'].transform(lambda val: val.fillna(val.mean()))percent_nan = percent_missing(df)sns.barplot(x=percent_nan.index,y=percent_nan)
plt.xticks(rotation=90);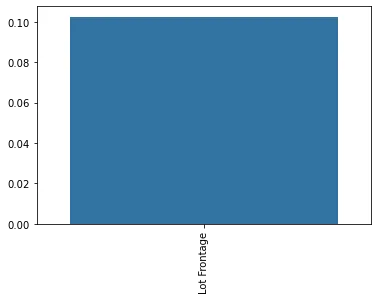
df['Lot Frontage'] = df['Lot Frontage'].fillna(0)percent_nan = percent_missing(df)percent_nanSeries([], dtype: float64)Great! We no longer have any missing data in our entire data set! Keep in mind, we should eventually turn all these transformations into an easy to use function. For now, lets' save this dataset:
df.to_csv("../DATA/Ames_NO_Missing_Data.csv",index=False)