Support Vector Machines
SVM - Regression
The concrete slump test measures the consistency of fresh concrete before it sets. It is performed to check the workability of freshly made concrete, and therefore the ease with which concrete flows. It can also be used as an indicator of an improperly mixed batch.

Our data set consists of various cement properties and the resulting slump test metrics in cm. Later on the set concrete is tested for its compressive strength 28 days later.
Input variables (7)(component kg in one M^3 concrete):
- Cement
- Slag
- Fly ash
- Water
- SP
- Coarse Aggr.
- Fine Aggr.
Output variables (3):
- SLUMP (cm)
- FLOW (cm)
- 28-day Compressive Strength (Mpa)
Data Source: https://archive.ics.uci.edu/ml/datasets/Concrete+Slump+Test
Credit: Yeh, I-Cheng, "Modeling slump flow of concrete using second-order regressions and artificial neural networks," Cement and Concrete Composites, Vol.29, No. 6, 474-480, 2007.
df = pd.read_csv('../DATA/cement_slump.csv')df.head()Cement
Slag
Fly ash
Water
SP60 more lines
Coarse Aggr.
Fine Aggr.
SLUMP(cm)
FLOW(cm)
Compressive Strength (28-day)(Mpa)
0
273.0
82.0
105.0
210.0
9.0
904.0
680.0
23.0
62.0
34.99
1
163.0
149.0
191.0
180.0
12.0
843.0
746.0
0.0
20.0
41.14
2
162.0
148.0
191.0
179.0
16.0
840.0
743.0
1.0
20.0
41.81
3
162.0
148.0
190.0
179.0
19.0
838.0
741.0
3.0
21.5
42.08
4
154.0
112.0
144.0
220.0
10.0
923.0
658.0
20.0
64.0
26.82df.corr()['Compressive Strength (28-day)(Mpa)']Cement 0.445656
Slag -0.331522
Fly ash 0.444380
Water -0.254320
SP -0.0379096 more lines
Coarse Aggr.                         -0.160610
Fine Aggr.                           -0.154532
SLUMP(cm)                            -0.223499
FLOW(cm)                             -0.124189
Compressive Strength (28-day)(Mpa)    1.000000
Name: Compressive Strength (28-day)(Mpa), dtype: float64plt.figure(figsize=(10, 6), dpi=100)
sns.heatmap(df.corr(), annot=True)<Axes: >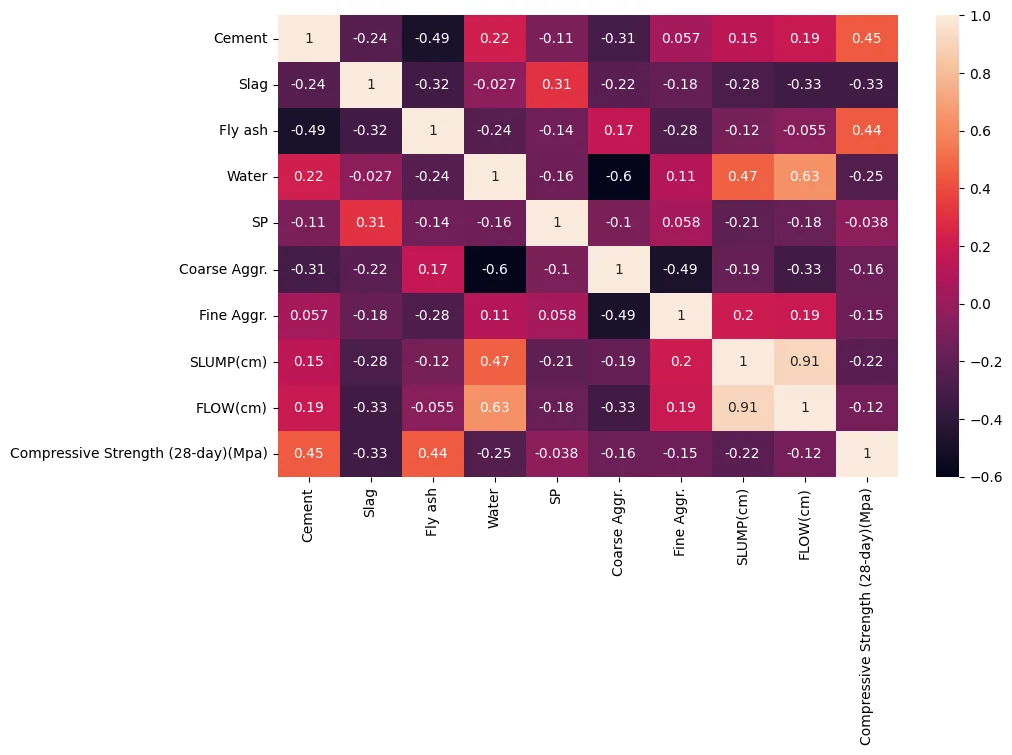
df.columnsIndex(['Cement', 'Slag', 'Fly ash', 'Water', 'SP', 'Coarse Aggr.',
'Fine Aggr.', 'SLUMP(cm)', 'FLOW(cm)',
'Compressive Strength (28-day)(Mpa)'],
dtype='object')Train | Test Split
Alternatively you could also set this up as a pipline, something like:
>> from sklearn.pipeline import make_pipeline
>> from sklearn.preprocessing import StandardScaler
>> from sklearn.svm import SVR
>> clf = make_pipeline(StandardScaler(), SVR())
df.columnsIndex(['Cement', 'Slag', 'Fly ash', 'Water', 'SP', 'Coarse Aggr.',
'Fine Aggr.', 'SLUMP(cm)', 'FLOW(cm)',
'Compressive Strength (28-day)(Mpa)'],
dtype='object')X = df.drop('Compressive Strength (28-day)(Mpa)',axis=1)
y = df['Compressive Strength (28-day)(Mpa)']from sklearn.model_selection import train_test_splitX_train, X_test, y_train, y_test = train_test_split(X, y, test_size=0.3, random_state=101)from sklearn.preprocessing import StandardScalerscaler = StandardScaler()scaled_X_train = scaler.fit_transform(X_train)
scaled_X_test = scaler.transform(X_test)Support Vector Machines - Regression
There are three different implementations of Support Vector Regression: SVR, NuSVR and LinearSVR. LinearSVR provides a faster implementation than SVR but only considers the linear kernel, while NuSVR implements a slightly different formulation than SVR and LinearSVR. See Implementation details for further details.
from sklearn.svm import SVR,LinearSVRSetting C: C is 1 by default and it’s a reasonable default choice. If you have a lot of noisy observations you should decrease it: decreasing C corresponds to more regularization.
LinearSVC and LinearSVR are less sensitive to C when it becomes large, and prediction results stop improving after a certain threshold. Meanwhile, larger C values will take more time to train, sometimes up to 10 times longer
Epsilon: https://stats.stackexchange.com/questions/259018/meaning-of-epsilon-in-svm-regression
base_model = SVR()base_model.fit(scaled_X_train,y_train)SVR()base_preds = base_model.predict(scaled_X_test)Evaluation
from sklearn.metrics import mean_absolute_error,mean_squared_errormean_absolute_error(y_test,base_preds)5.236902091259178np.sqrt(mean_squared_error(y_test,base_preds))6.695914838327133y_test.mean()36.26870967741935Grid Search in Attempt for Better Model
param_grid = {'C':[0.001,0.01,0.1,0.5,1],
             'kernel':['linear','rbf','poly'],
              'gamma':['scale','auto'],
              'degree':[2,3,4],
'epsilon':[0,0.01,0.1,0.5,1,2]}from sklearn.model_selection import GridSearchCVsvr = SVR()
grid = GridSearchCV(svr,param_grid=param_grid)grid.fit(scaled_X_train,y_train)GridSearchCV(estimator=SVR(),
param_grid={'C': [0.001, 0.01, 0.1, 0.5, 1], 'degree': [2, 3, 4],
'epsilon': [0, 0.01, 0.1, 0.5, 1, 2],
'gamma': ['scale', 'auto'],
'kernel': ['linear', 'rbf', 'poly']})grid.best_params_{'C': 1, 'degree': 2, 'epsilon': 2, 'gamma': 'scale', 'kernel': 'linear'}grid_preds = grid.predict(scaled_X_test)mean_absolute_error(y_test,grid_preds)2.5128012210762365np.sqrt(mean_squared_error(y_test,grid_preds))3.178210305119858Great improvement!