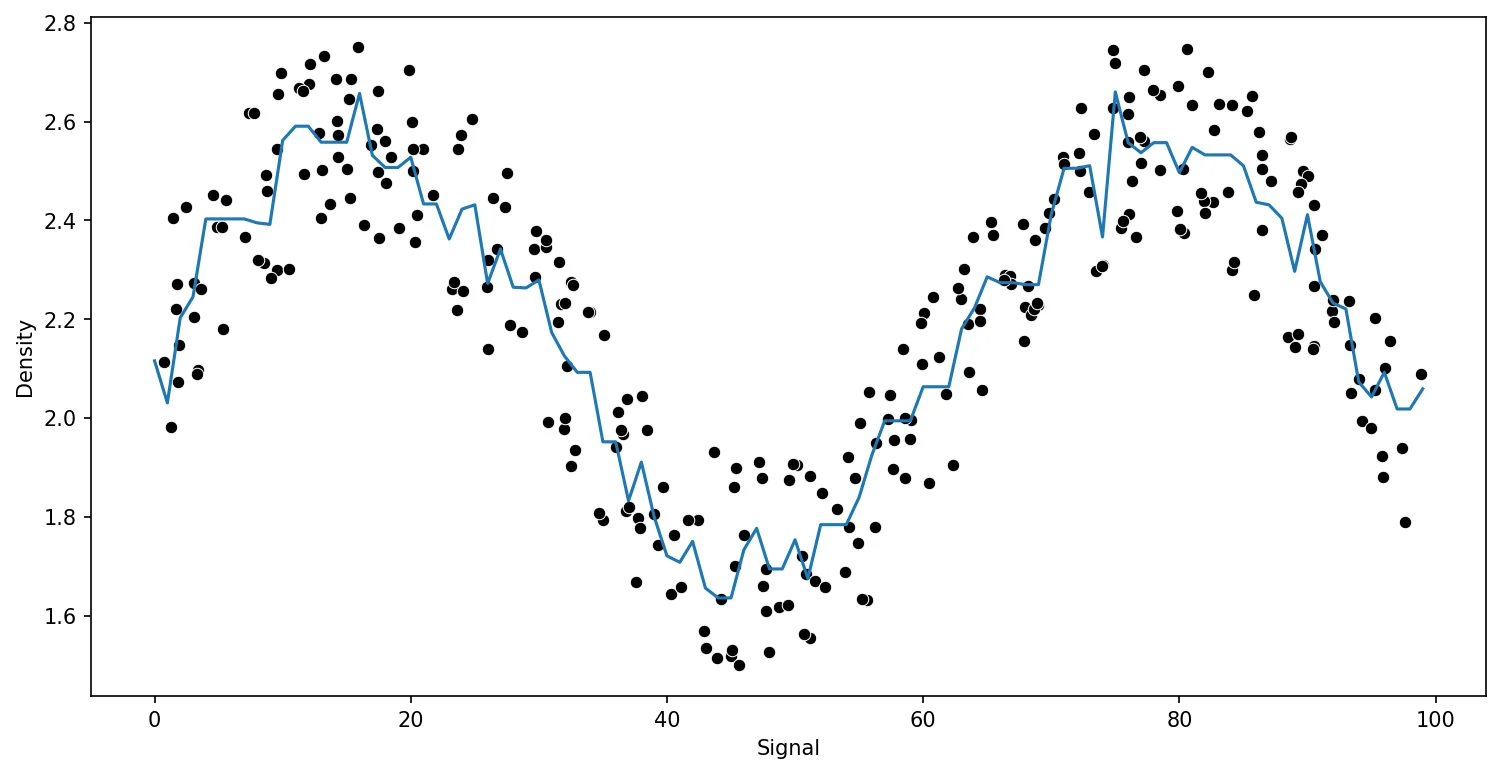
Random Forest - Regression
Plus: An Additional Analysis of Various Regression Methods!
The Data
We just got hired by a tunnel boring company which uses X-rays in an attempt to know rock density, ideally this will allow them to switch out boring heads on their equipment before having to mine through the rock!

They have given us some lab test results of signal strength returned in nHz to their sensors for various rock density types tested. You will notice it has almost a sine wave like relationship, where signal strength oscillates based off the density, the researchers are unsure why this is, but
df = pd.read_csv("../DATA/rock_density_xray.csv")df.head()Rebound Signal Strength nHz
Rock Density kg/m3
0
72.945124
2.45654812 more lines
1
14.229877
2.601719
2
36.597334
1.967004
3
9.578899
2.300439
4
21.765897
2.452374df.columns=['Signal',"Density"]plt.figure(figsize=(12,8),dpi=200)
sns.scatterplot(x='Signal',y='Density',data=df)<AxesSubplot:xlabel='Signal', ylabel='Density'>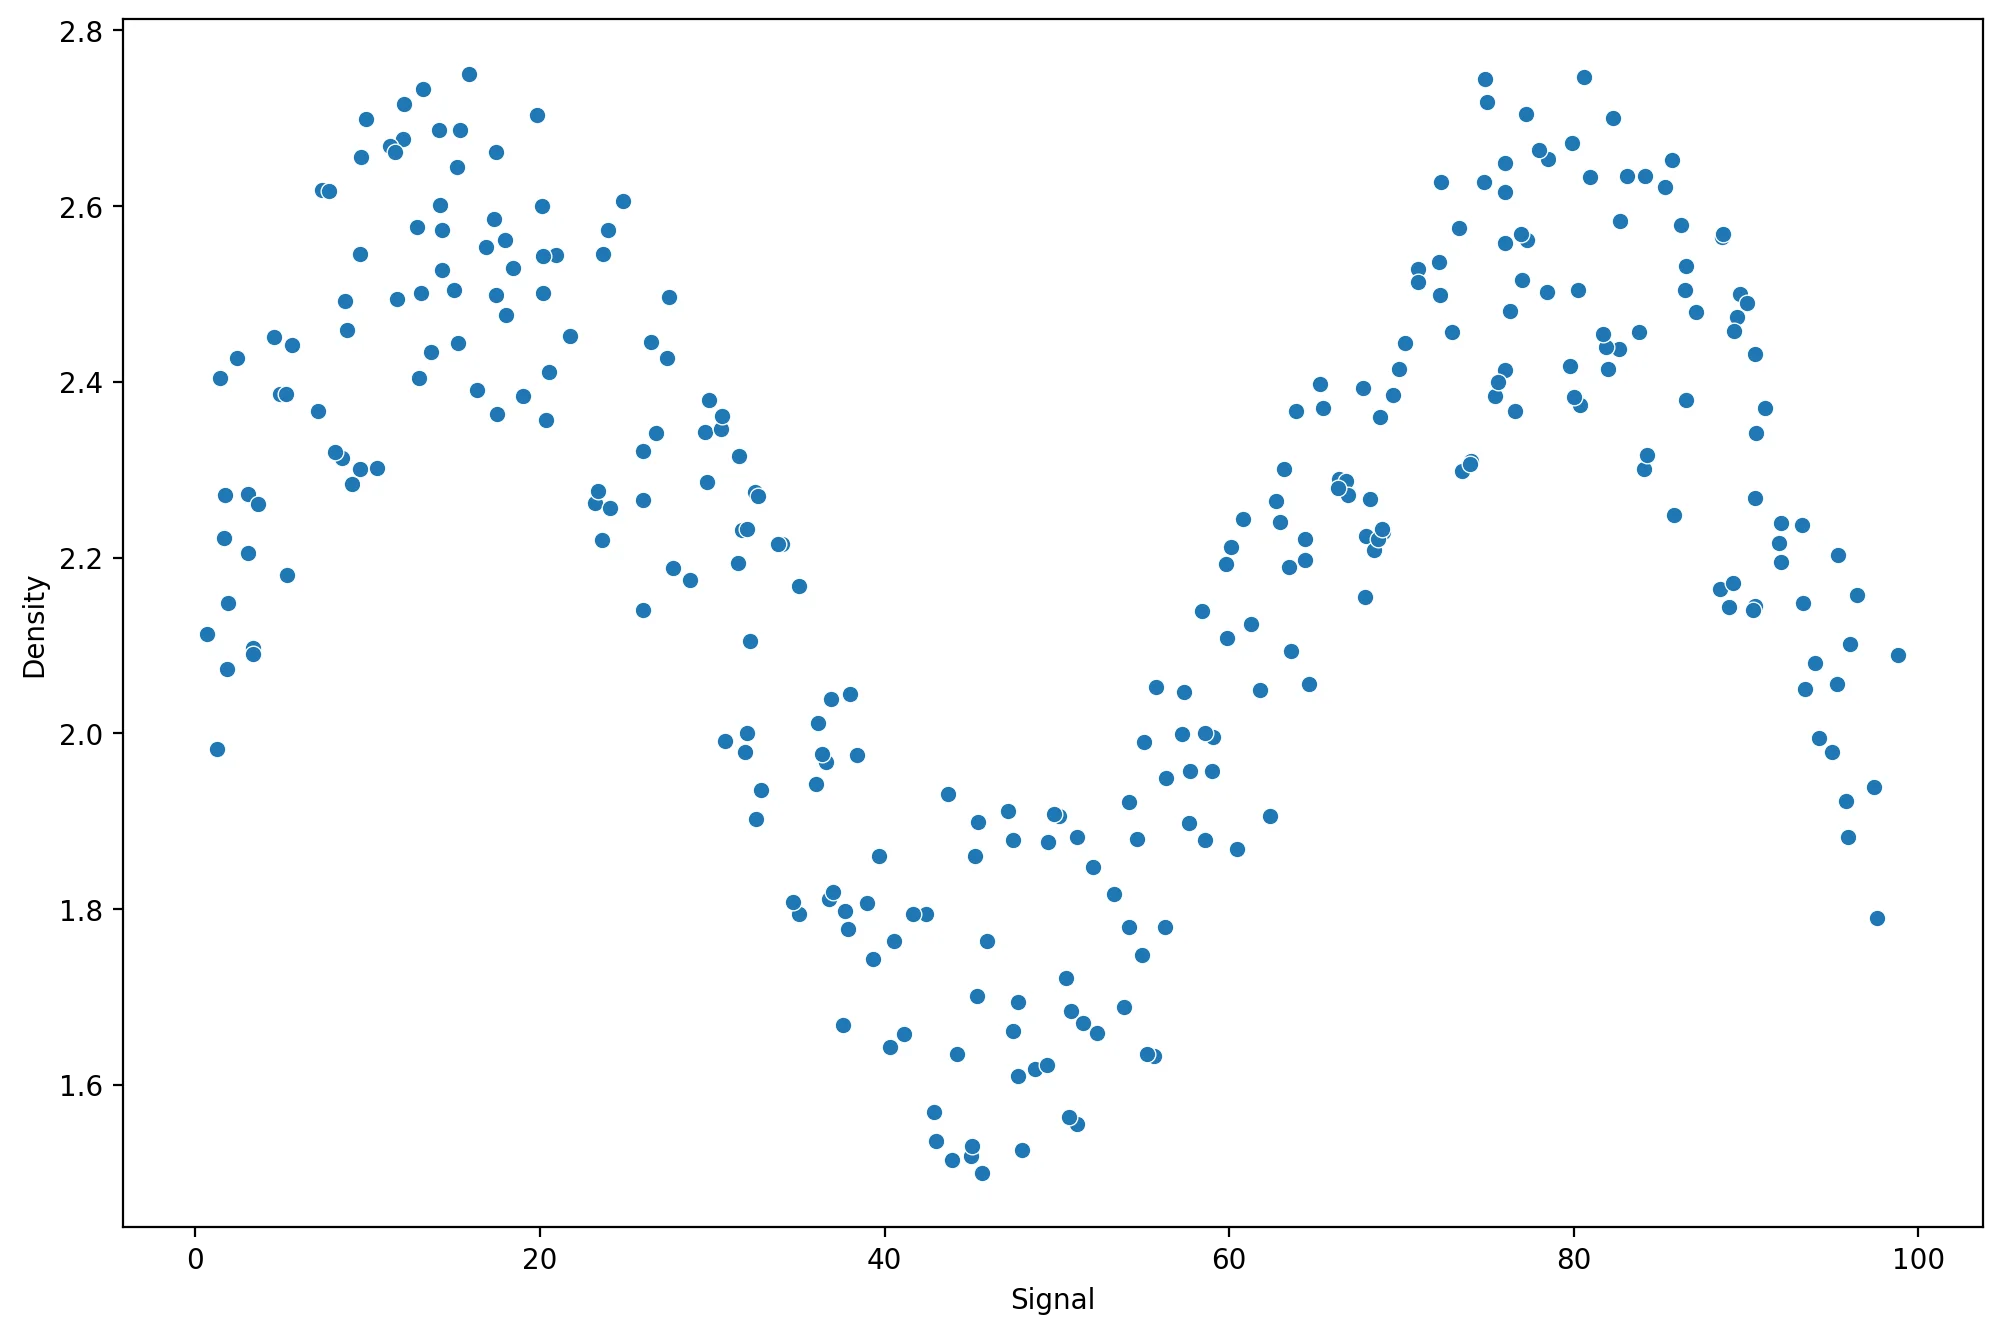
Splitting the Data
Let's split the data in order to be able to have a Test set for performance metric evaluation.
X = df['Signal'].values.reshape(-1,1)
y = df['Density']from sklearn.model_selection import train_test_splitX_train, X_test, y_train, y_test = train_test_split(X, y, test_size=0.1, random_state=101)Linear Regression
from sklearn.linear_model import LinearRegressionlr_model = LinearRegression()lr_model.fit(X_train,y_train)LinearRegression()lr_preds = lr_model.predict(X_test)from sklearn.metrics import mean_squared_errornp.sqrt(mean_squared_error(y_test,lr_preds))0.2570051996584629What does the fit look like?
signal_range = np.arange(0,100)lr_output = lr_model.predict(signal_range.reshape(-1,1))plt.figure(figsize=(12,8),dpi=200)
sns.scatterplot(x='Signal',y='Density',data=df,color='black')
plt.plot(signal_range,lr_output)[<matplotlib.lines.Line2D at 0x216f1c9c490>]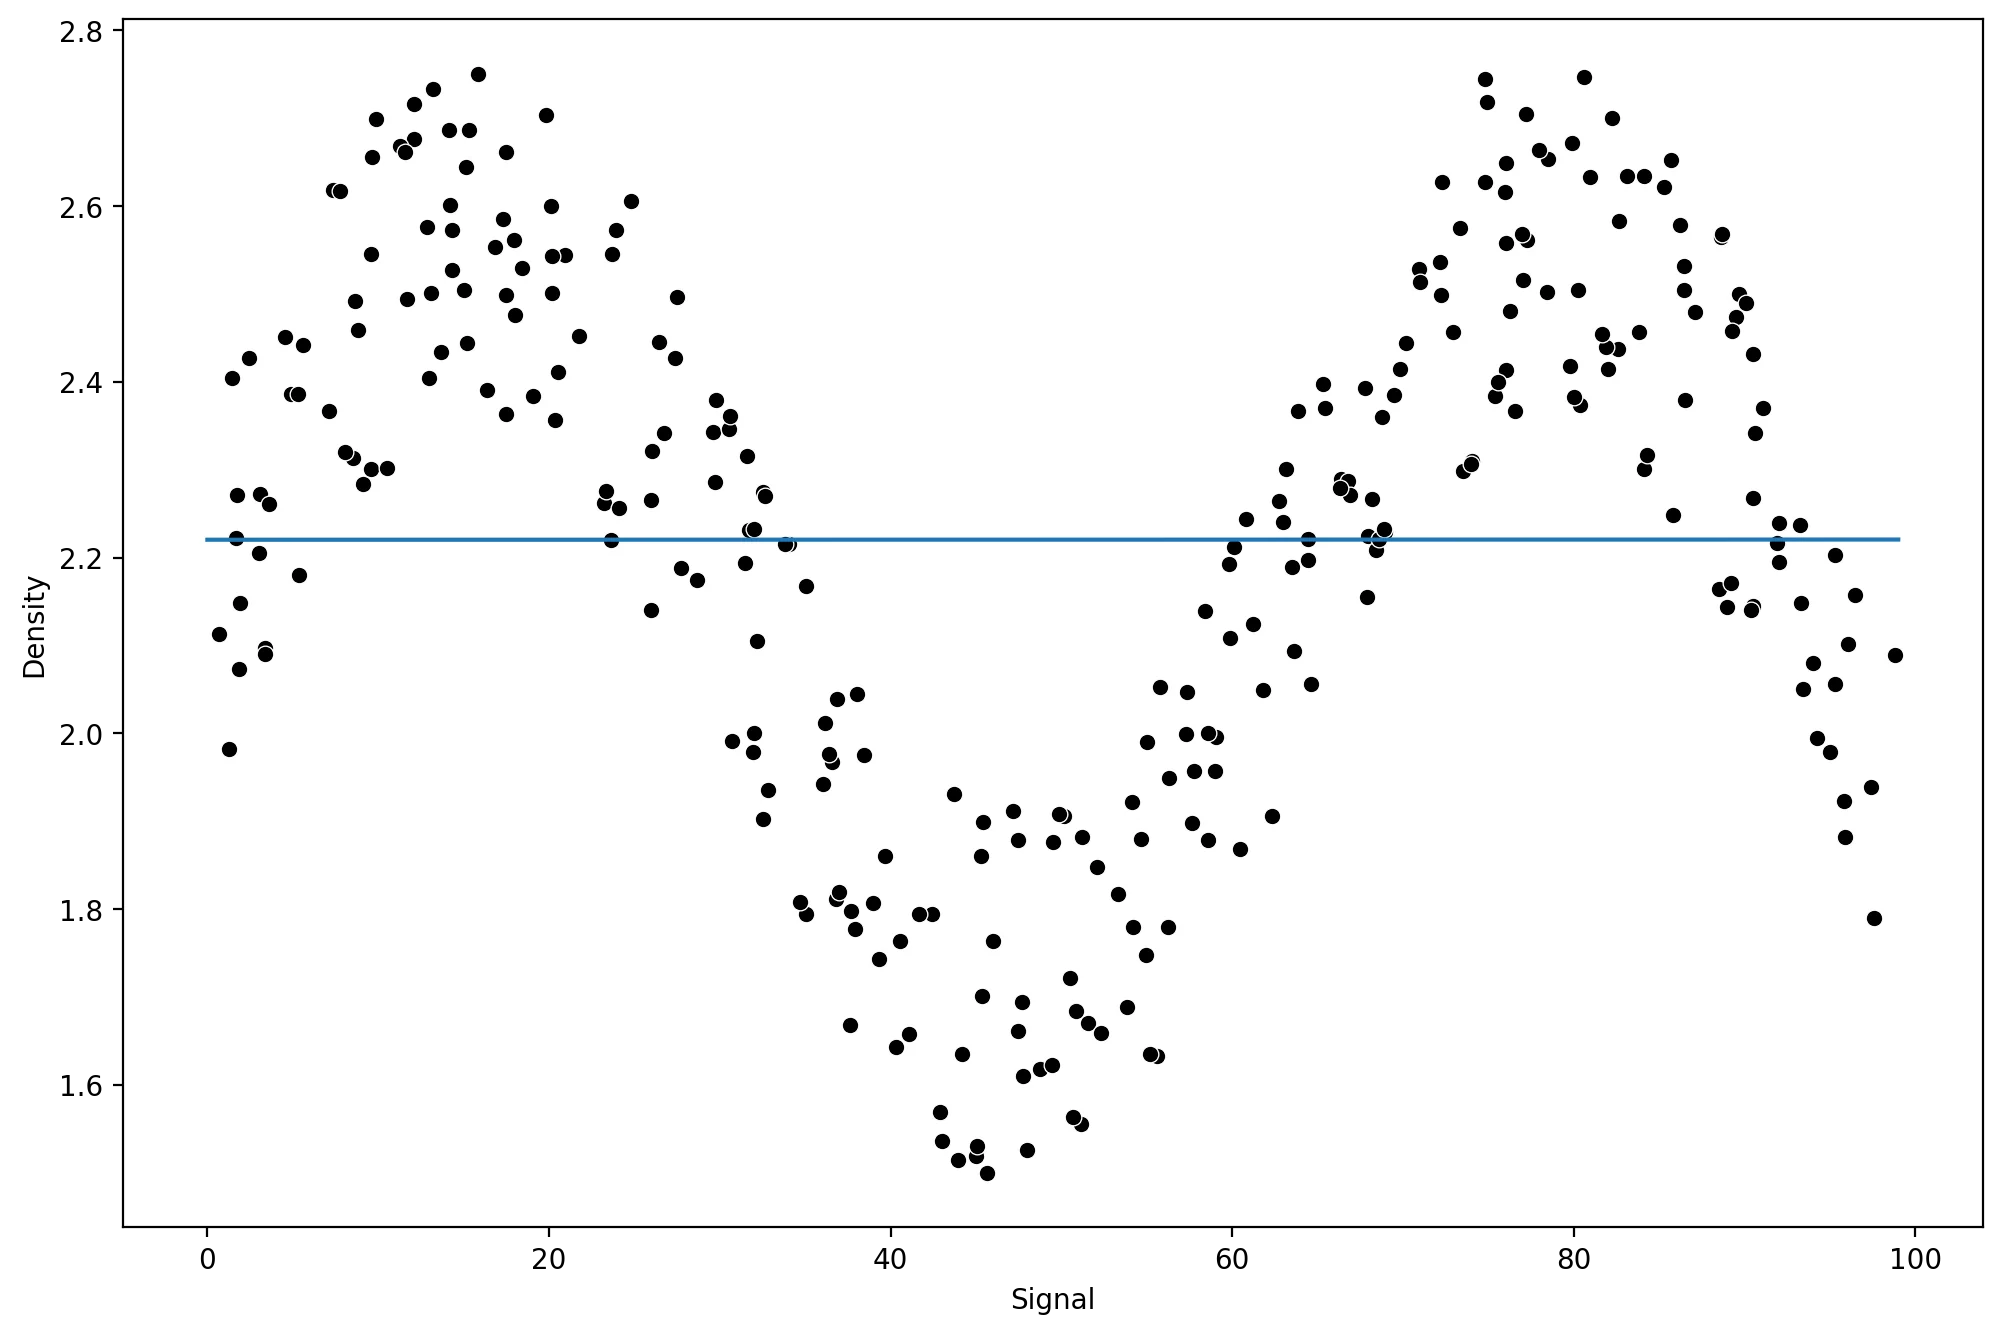
Polynomial Regression
Attempting with a Polynomial Regression Model
Let's explore why our standard regression approach of a polynomial could be difficult to fit here, keep in mind, we're in a fortunate situation where we can easily visualize results of y vs x.
Function to Help Run Models
from sklearn.linear_model import LinearRegression
model = LinearRegression()def run_model(model,X_train,y_train,X_test,y_test):
# Fit Model
model.fit(X_train,y_train)
# Get Metrics
preds = model.predict(X_test)
rmse = np.sqrt(mean_squared_error(y_test,preds))
print(f'RMSE : {rmse}')
# Plot results
signal_range = np.arange(0,100)
output = model.predict(signal_range.reshape(-1,1))
plt.figure(figsize=(12,6),dpi=150)
sns.scatterplot(x='Signal',y='Density',data=df,color='black')
plt.plot(signal_range,output)run_model(model,X_train,y_train,X_test,y_test)RMSE : 0.2570051996584629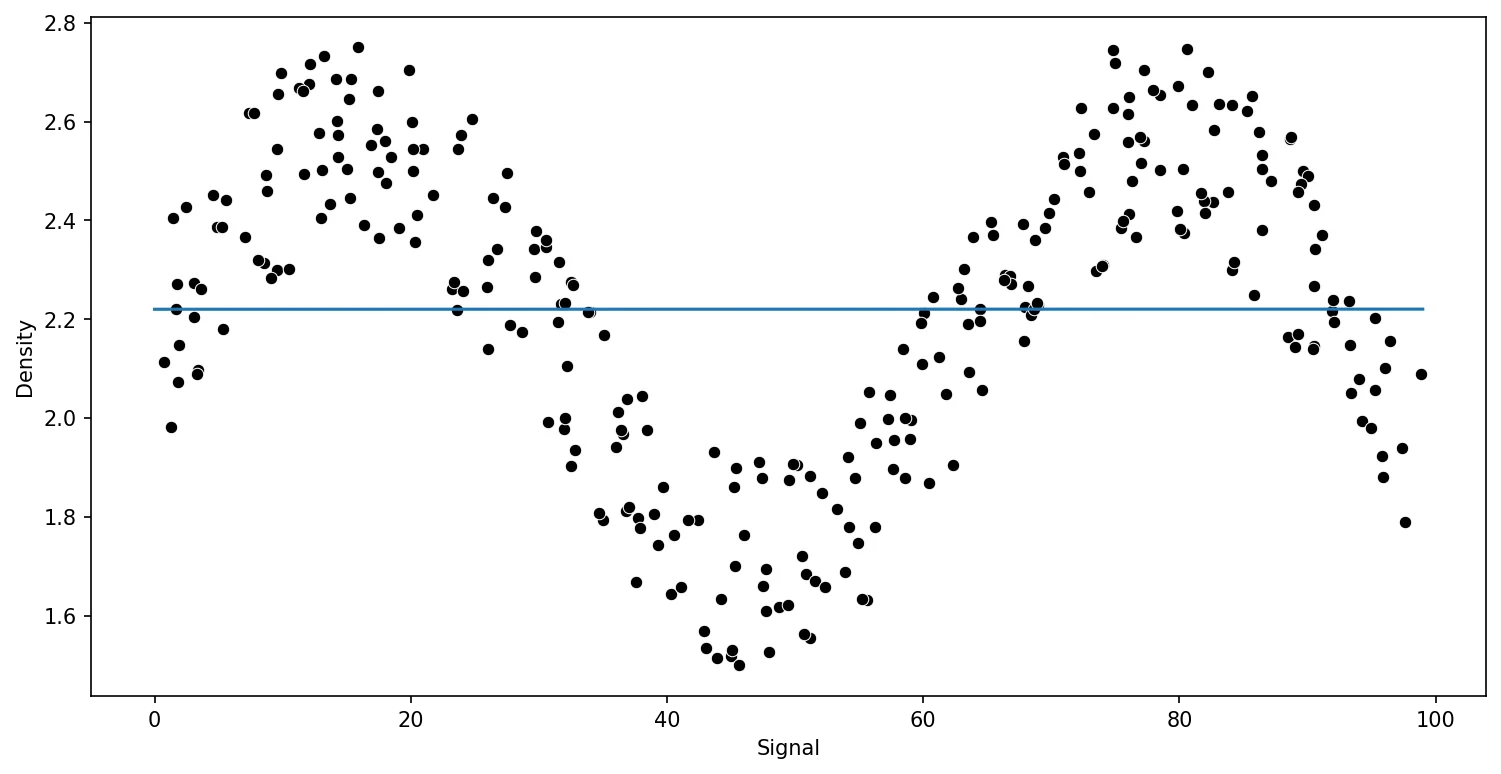
Pipeline for Poly Orders
from sklearn.pipeline import make_pipelinefrom sklearn.preprocessing import PolynomialFeaturespipe = make_pipeline(PolynomialFeatures(2),LinearRegression())run_model(pipe,X_train,y_train,X_test,y_test)RMSE : 0.2817309563725596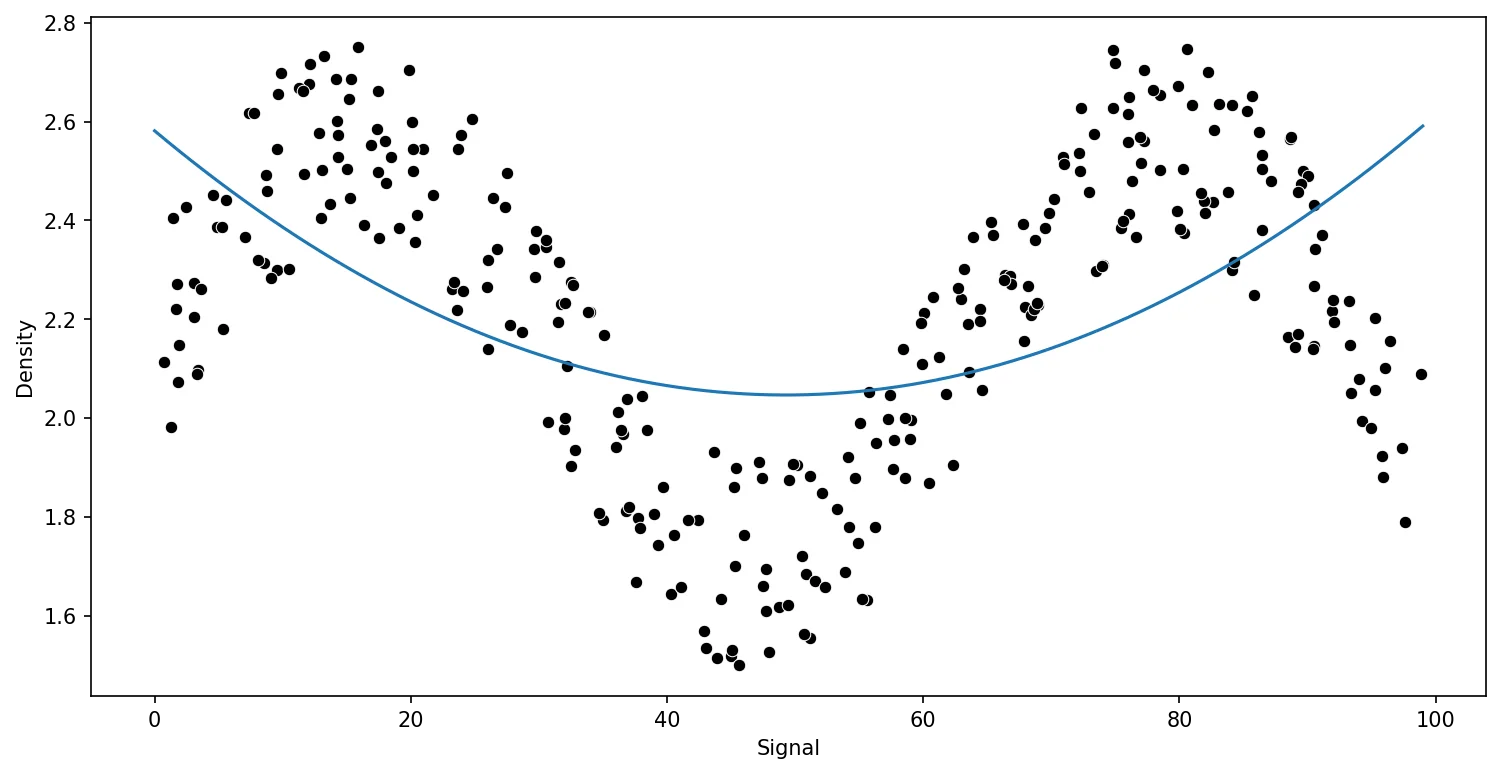
Comparing Various Polynomial Orders
pipe = make_pipeline(PolynomialFeatures(10),LinearRegression())
run_model(pipe,X_train,y_train,X_test,y_test)RMSE : 0.1417947898442399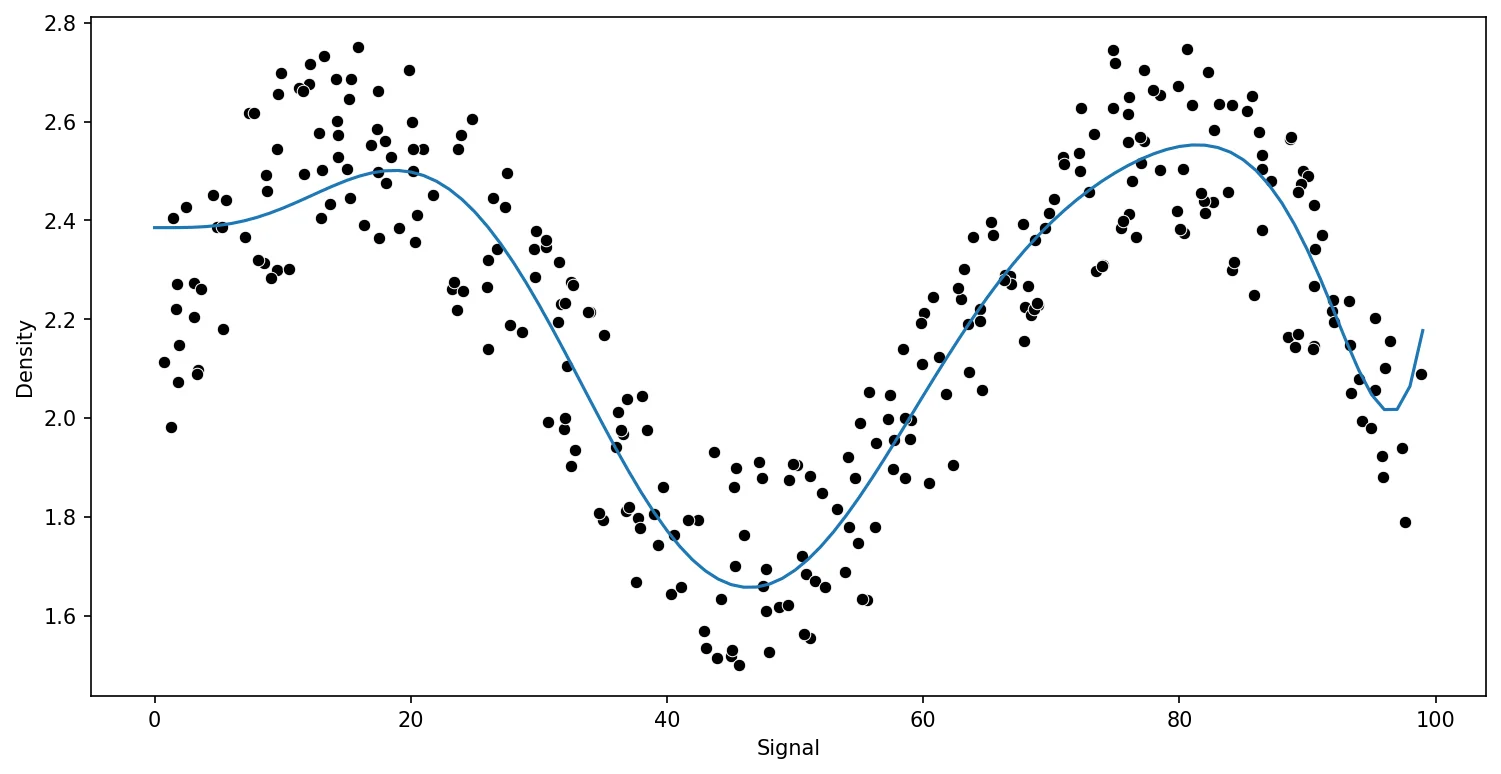
KNN Regression
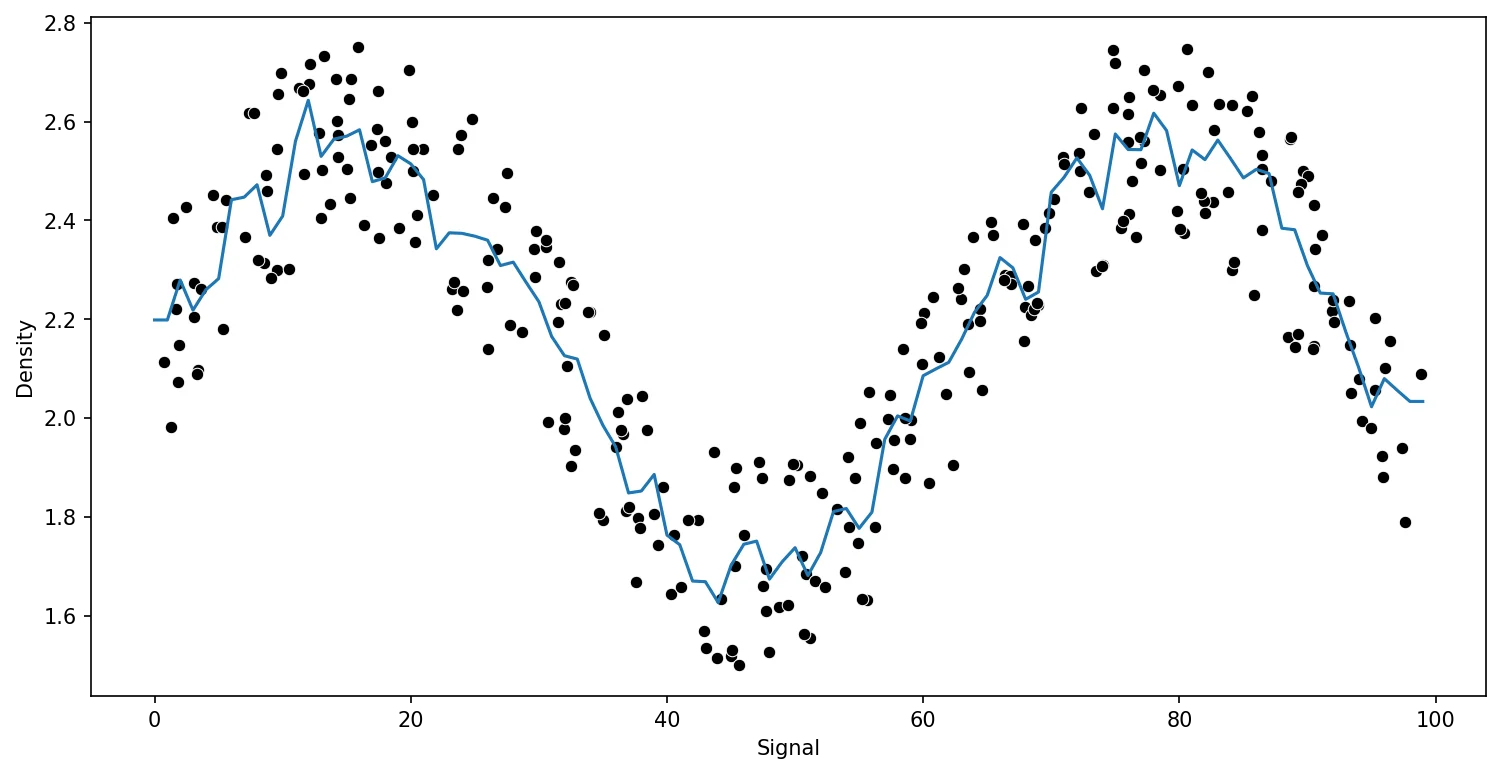
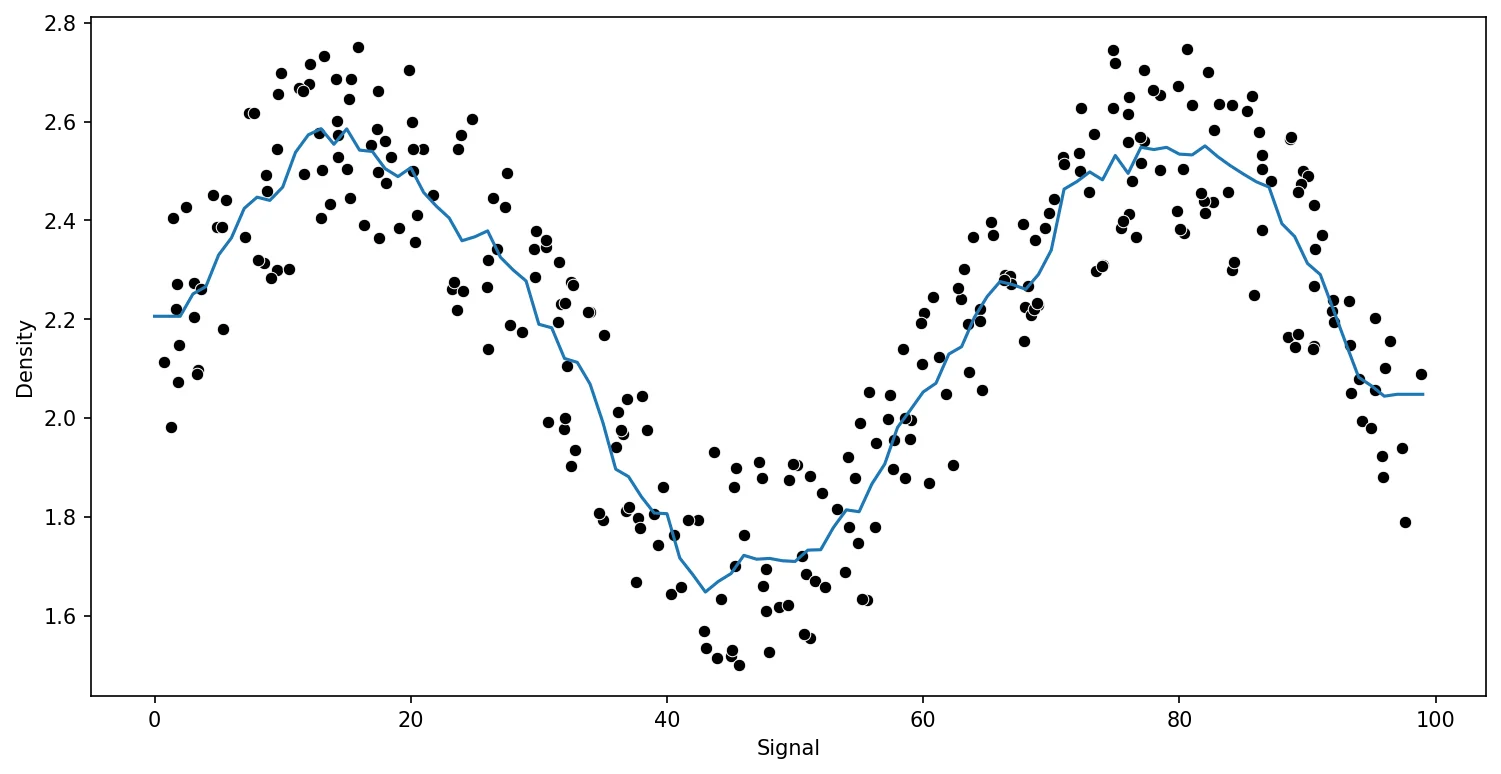
from sklearn.neighbors import KNeighborsRegressorpreds = {}
k_values = [1,5,10]
for n in k_values:
model = KNeighborsRegressor(n_neighbors=n)
run_model(model,X_train,y_train,X_test,y_test)RMSE : 0.15234870286353372
RMSE : 0.13730685016923655
RMSE : 0.13277855732740926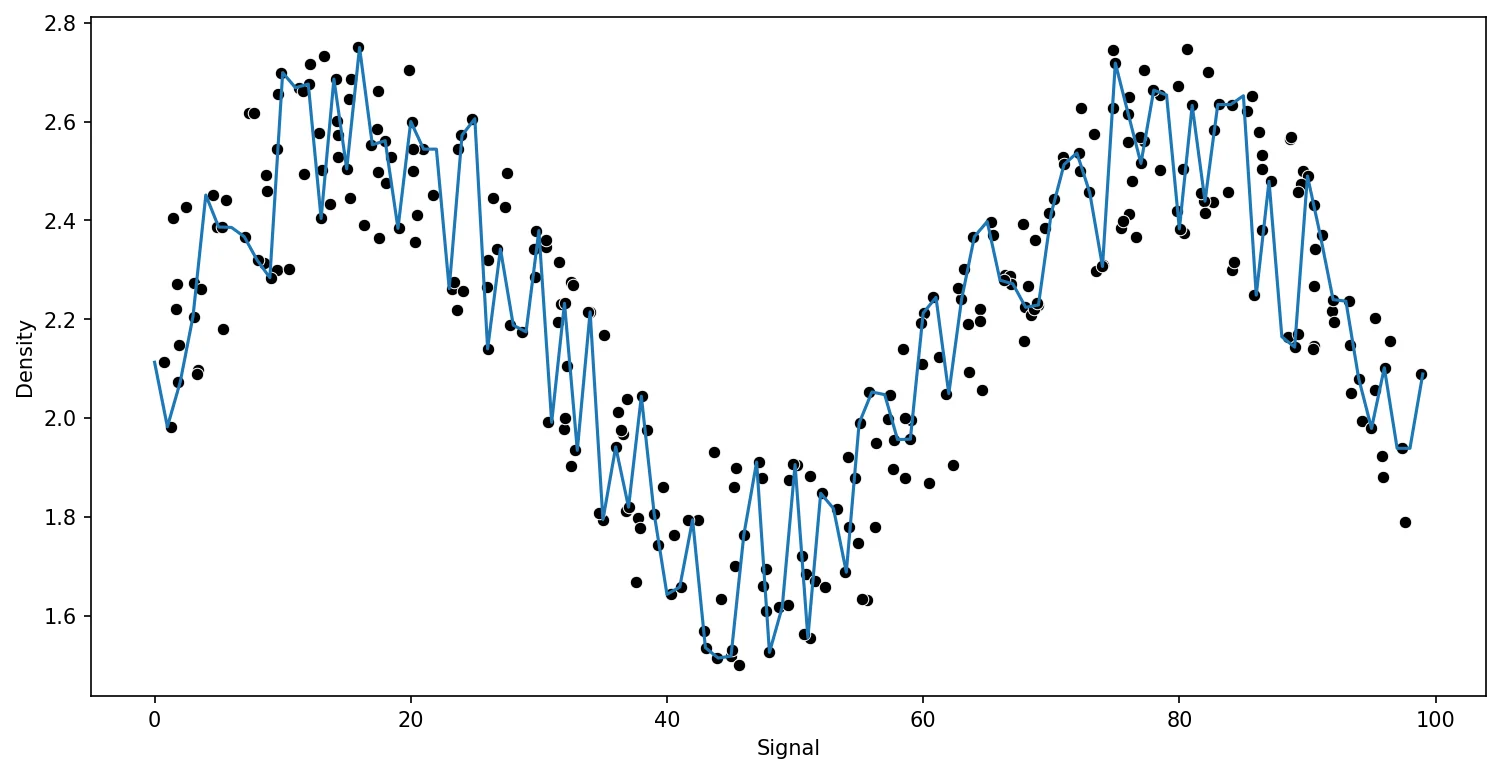
Decision Tree Regression
from sklearn.tree import DecisionTreeRegressormodel = DecisionTreeRegressor()
run_model(model,X_train,y_train,X_test,y_test)RMSE : 0.15234870286353372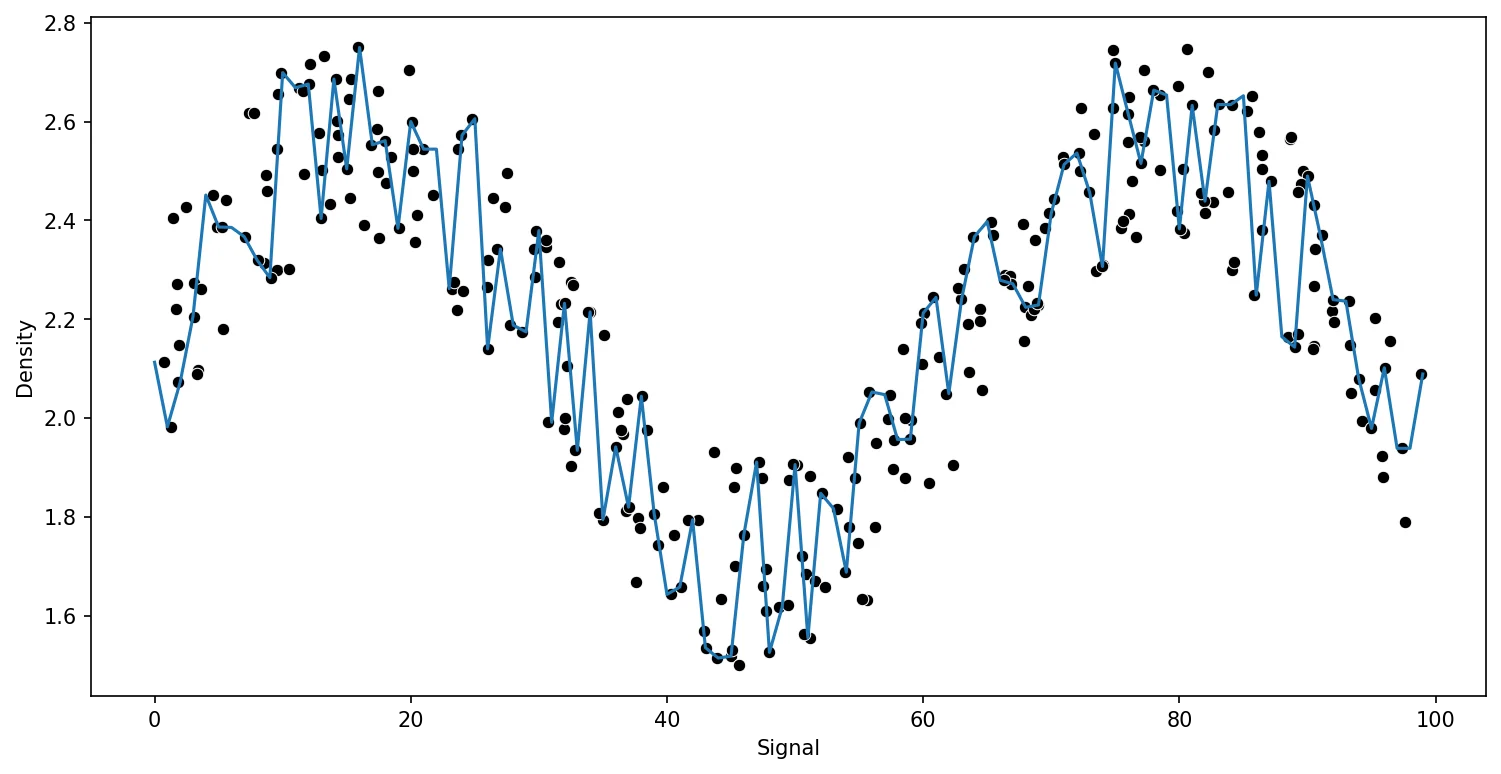
model.get_n_leaves()270Support Vector Regression
from sklearn.svm import SVRfrom sklearn.model_selection import GridSearchCVparam_grid = {'C':[0.01,0.1,1,5,10,100,1000],'gamma':['auto','scale']}
svr = SVR()grid = GridSearchCV(svr,param_grid)run_model(grid,X_train,y_train,X_test,y_test)RMSE : 0.12634668775105407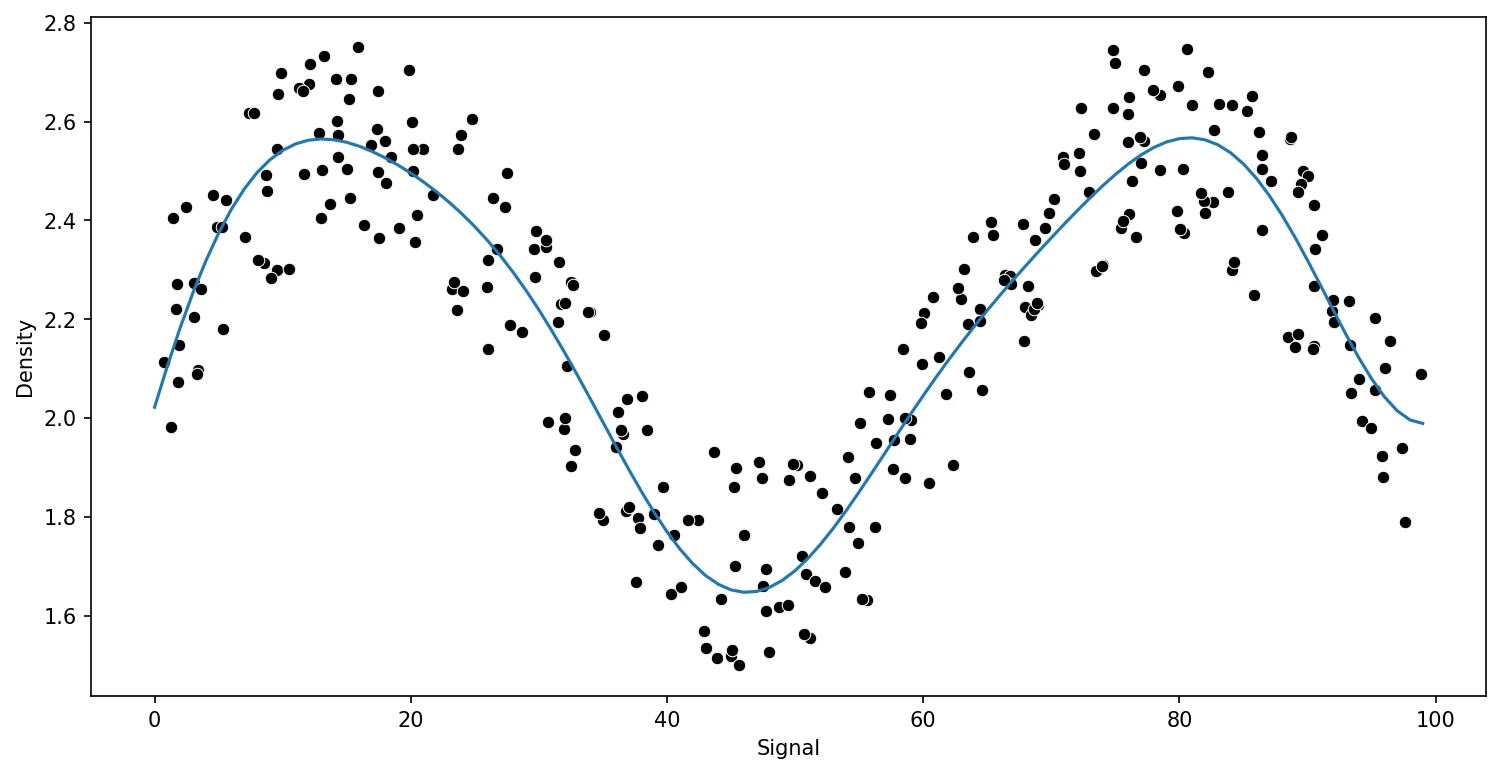
grid.best_estimator_SVR(C=1000)Random Forest Regression
from sklearn.ensemble import RandomForestRegressor# help(RandomForestRegressor)trees = [10,50,100]
for n in trees:
model = RandomForestRegressor(n_estimators=n)
run_model(model,X_train,y_train,X_test,y_test)RMSE : 0.1417613358931285
RMSE : 0.133281449397454
RMSE : 0.13699094997283662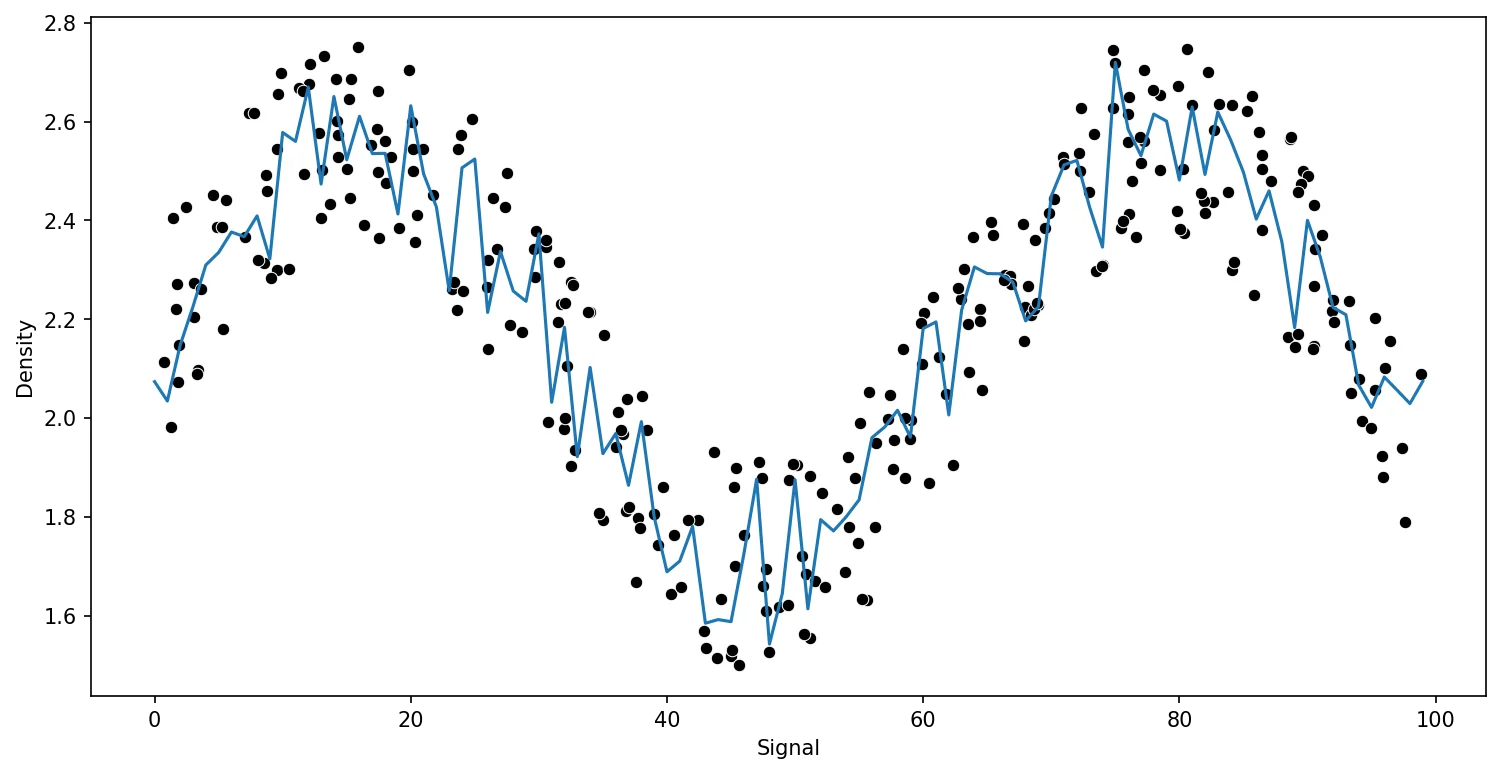
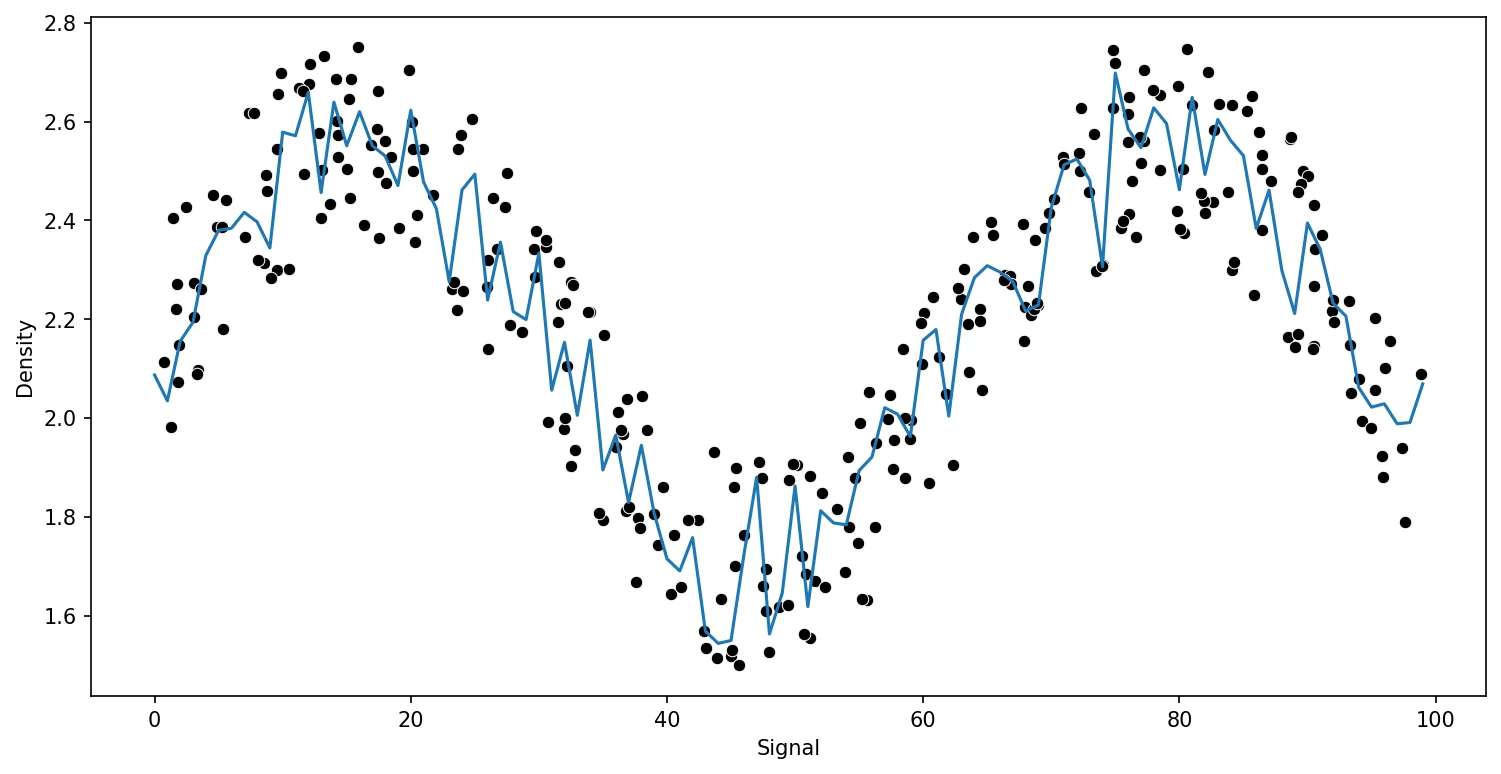
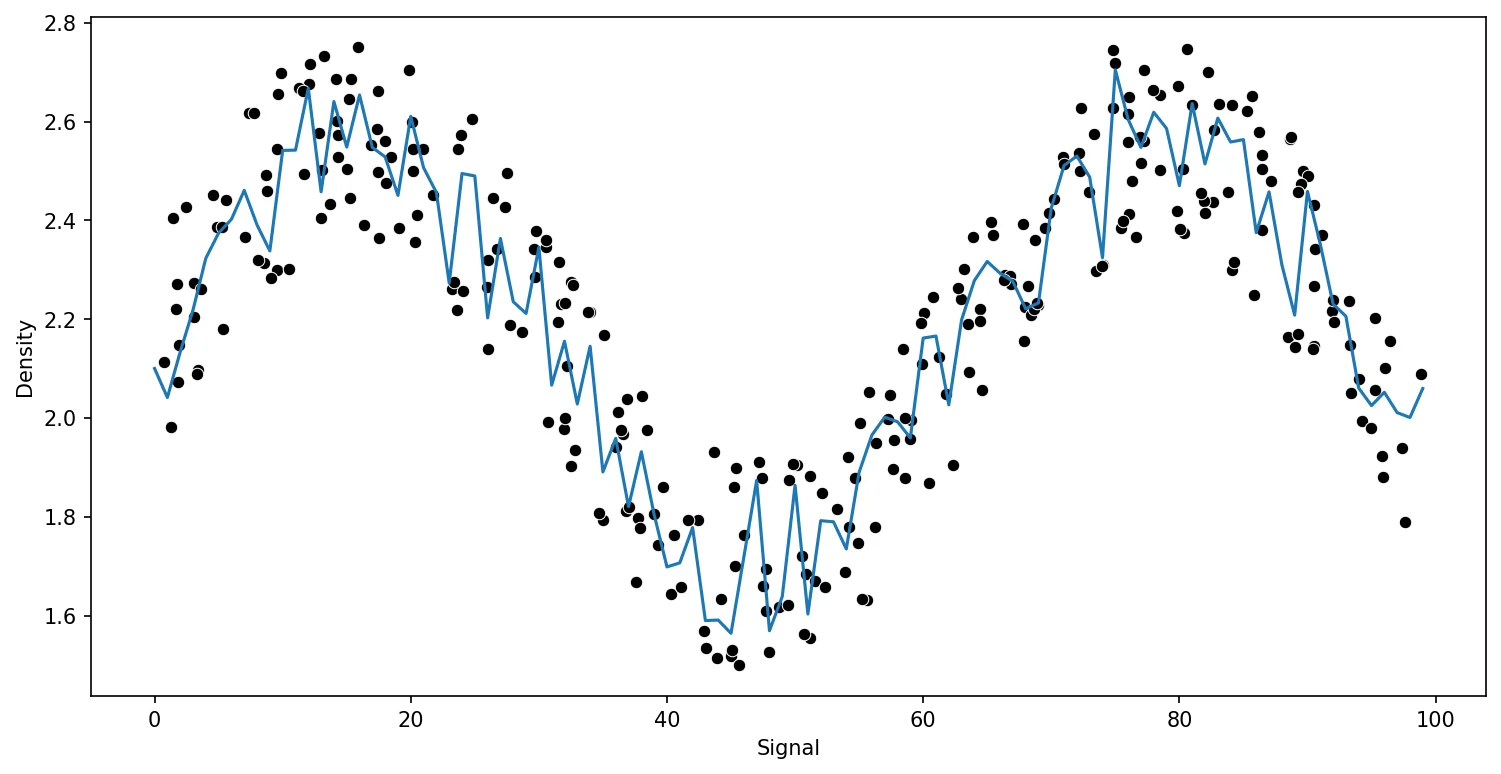
Gradient Boosting
We will cover this in more detail in next section.
from sklearn.ensemble import GradientBoostingRegressor# help(GradientBoostingRegressor)
model = GradientBoostingRegressor()

run_model(model,X_train,y_train,X_test,y_test)RMSE : 0.13294148649584667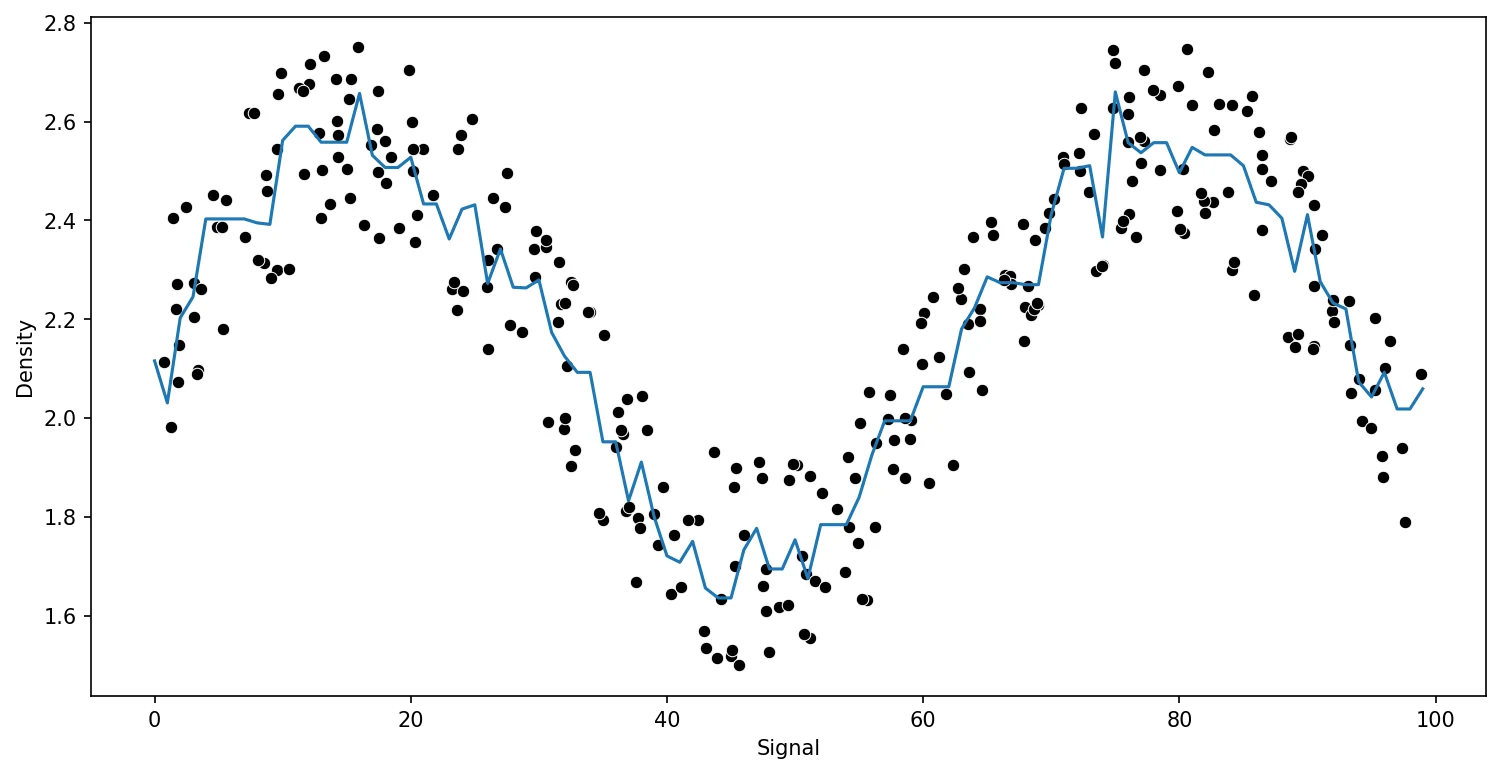
Adaboost
from sklearn.ensemble import AdaBoostRegressormodel = GradientBoostingRegressor()
run_model(model,X_train,y_train,X_test,y_test)RMSE : 0.13294148649584667