Capstone Project - Solution
Overview
If you are planning on going out to see a movie, how well can you trust online reviews and ratings? Especially if the same company showing the rating also makes money by selling movie tickets. Do they have a bias towards rating movies higher than they should be rated?
Goal:
Your goal is to complete the tasks below based off the 538 article and see if you reach a similar conclusion. You will need to use your pandas and visualization skills to determine if Fandango's ratings in 2015 had a bias towards rating movies better to sell more tickets.
Complete the tasks written in bold.
Part One: Understanding the Background and Data
TASK: Read this article: Be Suspicious Of Online Movie Ratings, Especially Fandango’s
TASK: After reading the article, read these two tables giving an overview of the two .csv files we will be working with:
The Data
This is the data behind the story Be Suspicious Of Online Movie Ratings, Especially Fandango’s openly available on 538's github: https://github.com/fivethirtyeight/data. There are two csv files, one with Fandango Stars and Displayed Ratings, and the other with aggregate data for movie ratings from other sites, like Metacritic,IMDB, and Rotten Tomatoes.
all_sites_scores.csv
all_sites_scores.csv{:python} contains every film that has a Rotten Tomatoes rating, a RT User rating, a Metacritic score, a Metacritic User score, and IMDb score, and at least 30 fan reviews on Fandango. The data from Fandango was pulled on Aug. 24, 2015.
Column | Definition --- | ----------- FILM | The film in question RottenTomatoes | The Rotten Tomatoes Tomatometer score for the film RottenTomatoes_User | The Rotten Tomatoes user score for the film Metacritic | The Metacritic critic score for the film Metacritic_User | The Metacritic user score for the film IMDB | The IMDb user score for the film Metacritic_user_vote_count | The number of user votes the film had on Metacritic IMDB_user_vote_count | The number of user votes the film had on IMDb
fandango_scape.csv
fandango_scrape.csv{:python} contains every film 538 pulled from Fandango.
Column | Definiton --- | --------- FILM | The movie STARS | Number of stars presented on Fandango.com RATING | The Fandango ratingValue for the film, as pulled from the HTML of each page. This is the actual average score the movie obtained. VOTES | number of people who had reviewed the film at the time we pulled it.
TASK: Import any libraries you think you will use:
# IMPORT HERE!Part Two: Exploring Fandango Displayed Scores versus True User Ratings
Let's first explore the Fandango ratings to see if our analysis agrees with the article's conclusion.
TASK: Run the cell below to read in the fandango_scrape.csv file
fandango = pd.read_csv("fandango_scrape.csv")TASK: Explore the DataFrame Properties and Head.
fandango.head()FILM
STARS
RATING
VOTES
024 more lines
Fifty Shades of Grey (2015)
4.0
3.9
34846
1
Jurassic World (2015)
4.5
4.5
34390
2
American Sniper (2015)
5.0
4.8
34085
3
Furious 7 (2015)
5.0
4.8
33538
4
Inside Out (2015)
4.5
4.5
15749fandango.info()<class 'pandas.core.frame.DataFrame'>
RangeIndex: 504 entries, 0 to 503
Data columns (total 4 columns):
# Column Non-Null Count Dtype
--- ------ -------------- ----- 6 more lines
 0   FILM    504 non-null    object
 1   STARS   504 non-null    float64
 2   RATING  504 non-null    float64
 3   VOTES   504 non-null    int64
dtypes: float64(2), int64(1), object(1)
memory usage: 15.9+ KBfandango.describe()STARS
RATING
VOTES
count
504.00000030 more lines
504.000000
504.000000
mean
3.558532
3.375794
1147.863095
std
1.563133
1.491223
3830.583136
min
0.000000
0.000000
0.000000
25%
3.500000
3.100000
3.000000
50%
4.000000
3.800000
18.500000
75%
4.500000
4.300000
189.750000
max
5.000000
5.000000
34846.000000
TASK: Let's explore the relationship between popularity of a film and its rating. Create a scatterplot showing the relationship between rating and votes. Feel free to edit visual styling to your preference.
# CODE HEREplt.figure(figsize=(10,4),dpi=150)
sns.scatterplot(data=fandango,x='RATING',y='VOTES');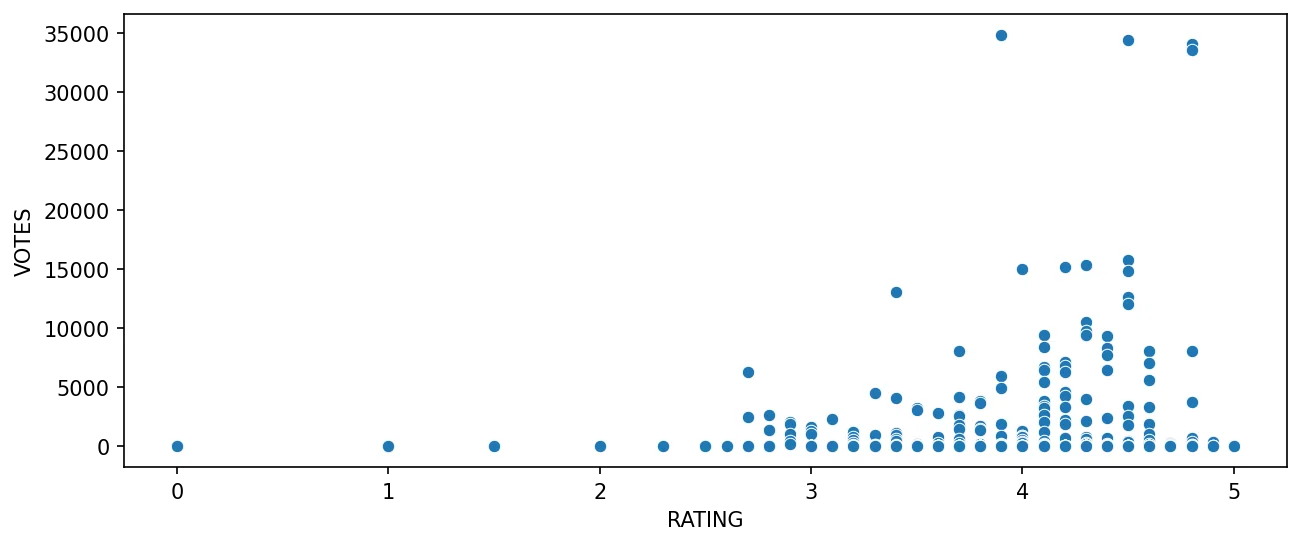
TASK: Calculate the correlation between the columns:
# CODE HEREfandango.corr()STARS
RATING
VOTES
STARS
1.00000010 more lines
0.994696
0.164218
RATING
0.994696
1.000000
0.163764
VOTES
0.164218
0.163764
1.000000
TASK: Assuming that every row in the FILM title column has the same format:
Film Title Name (Year)
Create a new column that is able to strip the year from the title strings and set this new column as YEAR
# CODE HEREfandango['YEAR'] = fandango['FILM'].apply(lambda title:title.split('(')[-1])TASK: How many movies are in the Fandango DataFrame per year?
#CODE HEREfandango['YEAR'].value_counts()2015 478
2014 23
2016 1
1964 1
2012 11 more line
Name: YEAR, dtype: int64TASK: Visualize the count of movies per year with a plot:
#CODE HEREsns.countplot(data=fandango,x='YEAR')<AxesSubplot:xlabel='YEAR', ylabel='count'>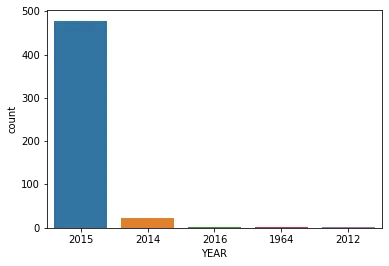
TASK: What are the 10 movies with the highest number of votes?
#CODE HEREfandango.nlargest(10,'VOTES')FILM
STARS
RATING
VOTES
YEAR60 more lines
0
Fifty Shades of Grey (2015)
4.0
3.9
34846
2015
1
Jurassic World (2015)
4.5
4.5
34390
2015
2
American Sniper (2015)
5.0
4.8
34085
2015
3
Furious 7 (2015)
5.0
4.8
33538
2015
4
Inside Out (2015)
4.5
4.5
15749
2015
5
The Hobbit: The Battle of the Five Armies (2014)
4.5
4.3
15337
2014
6
Kingsman: The Secret Service (2015)
4.5
4.2
15205
2015
7
Minions (2015)
4.0
4.0
14998
2015
8
Avengers: Age of Ultron (2015)
5.0
4.5
14846
2015
9
Into the Woods (2014)
3.5
3.4
13055
2014
TASK: How many movies have zero votes?
#CODE HEREno_votes = fandango['VOTES']==0
no_votes.sum()69TASK: Create DataFrame of only reviewed films by removing any films that have zero votes.
#CODE HEREfan_reviewed = fandango[fandango['VOTES']>0]As noted in the article, due to HTML and star rating displays, the true user rating may be slightly different than the rating shown to a user. Let's visualize this difference in distributions.
TASK: Create a KDE plot (or multiple kdeplots) that displays the distribution of ratings that are displayed (STARS) versus what the true rating was from votes (RATING). Clip the KDEs to 0-5.
#CODE HEREplt.figure(figsize=(10,4),dpi=150)
sns.kdeplot(data=fan_reviewed,x='RATING',clip=[0,5],fill=True,label='True Rating')
sns.kdeplot(data=fan_reviewed,x='STARS',clip=[0,5],fill=True,label='Stars Displayed')
plt.legend(loc=(1.05,0.5))<matplotlib.legend.Legend at 0x1aa0110cdc8>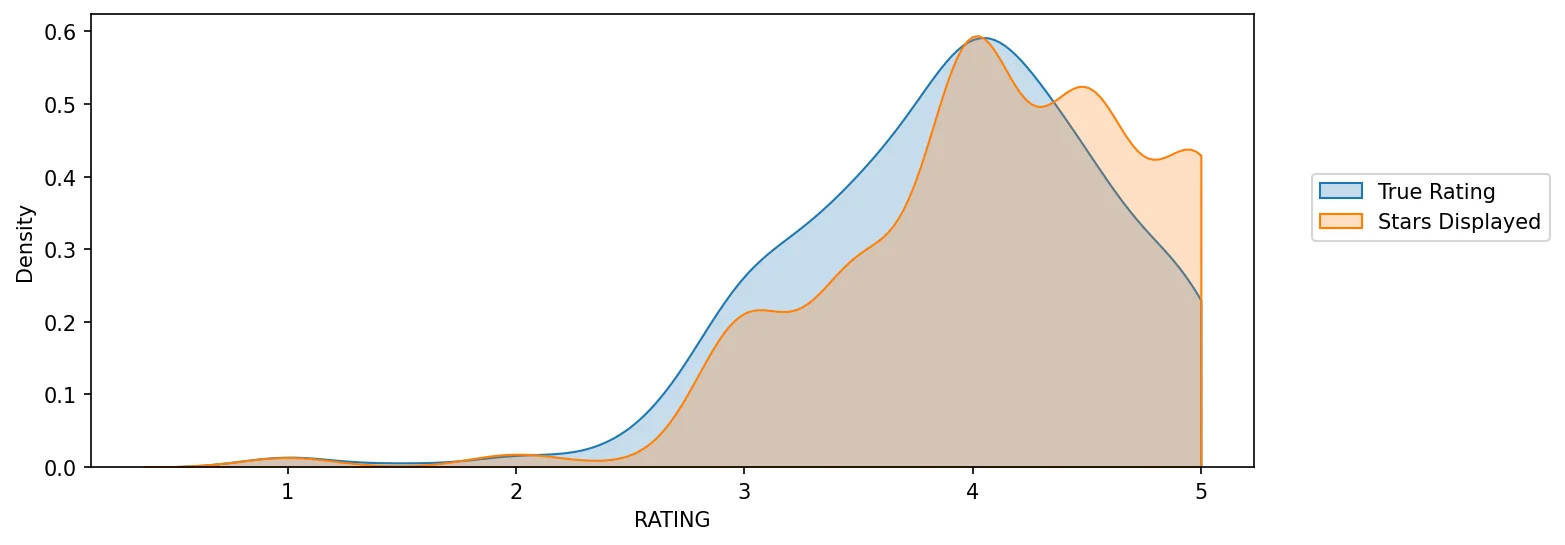
TASK: Let's now actually quantify this discrepancy. Create a new column of the different between STARS displayed versus true RATING. Calculate this difference with STARS-RATING and round these differences to the nearest decimal point.
#CODE HEREfan_reviewed["STARS_DIFF"] = fan_reviewed['STARS'] - fan_reviewed['RATING']
fan_reviewed['STARS_DIFF'] = fan_reviewed['STARS_DIFF'].round(2)fan_reviewedFILM
STARS
RATING
VOTES
YEAR79 more lines
STARS_DIFF
0
Fifty Shades of Grey (2015)
4.0
3.9
34846
2015
0.1
1
Jurassic World (2015)
4.5
4.5
34390
2015
0.0
2
American Sniper (2015)
5.0
4.8
34085
2015
0.2
3
Furious 7 (2015)
5.0
4.8
33538
2015
0.2
4
Inside Out (2015)
4.5
4.5
15749
2015
0.0
...
...
...
...
...
...
...
430
That Sugar Film (2015)
5.0
5.0
1
2015
0.0
431
The Intern (2015)
5.0
5.0
1
2015
0.0
432
The Park Bench (2015)
5.0
5.0
1
2015
0.0
433
The Wanted 18 (2015)
5.0
5.0
1
2015
0.0
434
Z For Zachariah (2015)
5.0
5.0
1
2015
0.0
435 rows × 6 columns
TASK: Create a count plot to display the number of times a certain difference occurs:
#CODE HEREplt.figure(figsize=(12,4),dpi=150)
sns.countplot(data=fan_reviewed,x='STARS_DIFF',palette='magma')<AxesSubplot:xlabel='STARS_DIFF', ylabel='count'>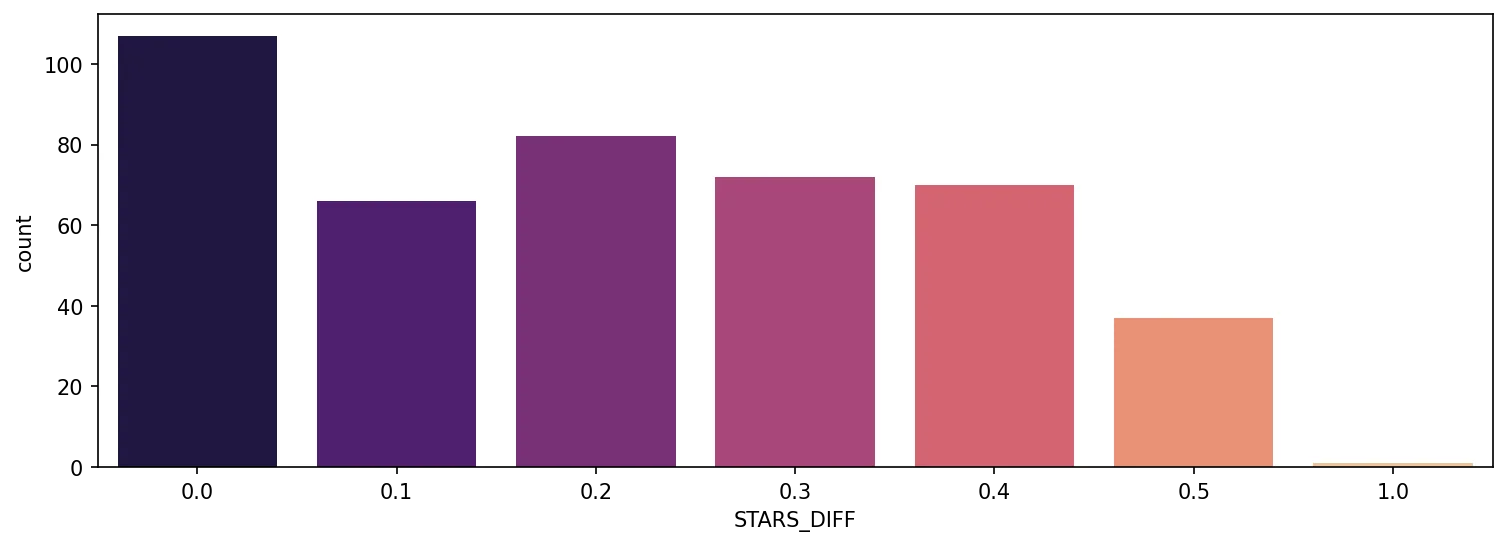
TASK: We can see from the plot that one movie was displaying over a 1 star difference than its true rating! What movie had this close to 1 star differential?
#CODE HEREfan_reviewed[fan_reviewed['STARS_DIFF'] == 1]FILM
STARS
RATING
VOTES
YEAR8 more lines
STARS_DIFF
381
Turbo Kid (2015)
5.0
4.0
2
2015
1.0
Part Three: Comparison of Fandango Ratings to Other Sites
Let's now compare the scores from Fandango to other movies sites and see how they compare.
TASK: Read in the "all_sites_scores.csv" file by running the cell below
all_sites = pd.read_csv("all_sites_scores.csv")TASK: Explore the DataFrame columns, info, description.
all_sites.head()FILM
RottenTomatoes
RottenTomatoes_User
Metacritic
Metacritic_User48 more lines
IMDB
Metacritic_user_vote_count
IMDB_user_vote_count
0
Avengers: Age of Ultron (2015)
74
86
66
7.1
7.8
1330
271107
1
Cinderella (2015)
85
80
67
7.5
7.1
249
65709
2
Ant-Man (2015)
80
90
64
8.1
7.8
627
103660
3
Do You Believe? (2015)
18
84
22
4.7
5.4
31
3136
4
Hot Tub Time Machine 2 (2015)
14
28
29
3.4
5.1
88
19560all_sites.info()<class 'pandas.core.frame.DataFrame'>
RangeIndex: 146 entries, 0 to 145
Data columns (total 8 columns):
# Column Non-Null Count Dtype
--- ------ -------------- ----- 10 more lines
 0   FILM                        146 non-null    object
 1   RottenTomatoes              146 non-null    int64
 2   RottenTomatoes_User         146 non-null    int64
 3   Metacritic                  146 non-null    int64
 4   Metacritic_User             146 non-null    float64
 5   IMDB                        146 non-null    float64
 6   Metacritic_user_vote_count  146 non-null    int64
 7   IMDB_user_vote_count        146 non-null    int64
dtypes: float64(2), int64(5), object(1)
memory usage: 9.2+ KBall_sites.describe()RottenTomatoes
RottenTomatoes_User
Metacritic
Metacritic_User
IMDB66 more lines
Metacritic_user_vote_count
IMDB_user_vote_count
count
146.000000
146.000000
146.000000
146.000000
146.000000
146.000000
146.000000
mean
60.849315
63.876712
58.808219
6.519178
6.736986
185.705479
42846.205479
std
30.168799
20.024430
19.517389
1.510712
0.958736
316.606515
67406.509171
min
5.000000
20.000000
13.000000
2.400000
4.000000
4.000000
243.000000
25%
31.250000
50.000000
43.500000
5.700000
6.300000
33.250000
5627.000000
50%
63.500000
66.500000
59.000000
6.850000
6.900000
72.500000
19103.000000
75%
89.000000
81.000000
75.000000
7.500000
7.400000
168.500000
45185.750000
max
100.000000
94.000000
94.000000
9.600000
8.600000
2375.000000
334164.000000Rotten Tomatoes
Let's first take a look at Rotten Tomatoes. RT has two sets of reviews, their critics reviews (ratings published by official critics) and user reviews.
TASK: Create a scatterplot exploring the relationship between RT Critic reviews and RT User reviews.
# CODE HEREplt.figure(figsize=(10,4),dpi=150)
sns.scatterplot(data=all_sites,x='RottenTomatoes',y='RottenTomatoes_User')
plt.xlim(0,100)
plt.ylim(0,100)(0.0, 100.0)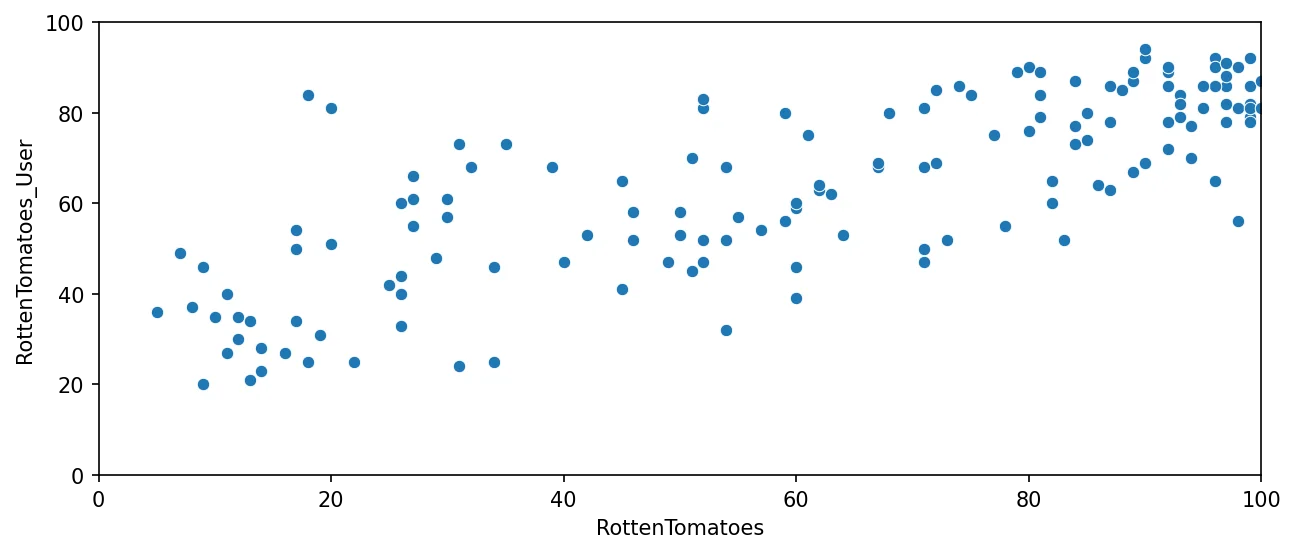
Let's quantify this difference by comparing the critics ratings and the RT User ratings. We will calculate this with RottenTomatoes-RottenTomatoes_User. Note: Rotten_Diff here is Critics - User Score. So values closer to 0 means aggrement between Critics and Users. Larger positive values means critics rated much higher than users. Larger negative values means users rated much higher than critics.
TASK: Create a new column based off the difference between critics ratings and users ratings for Rotten Tomatoes. Calculate this with RottenTomatoes-RottenTomatoes_User
#CODE HEREall_sites['Rotten_Diff'] = all_sites['RottenTomatoes'] - all_sites['RottenTomatoes_User']Let's now compare the overall mean difference. Since we're dealing with differences that could be negative or positive, first take the absolute value of all the differences, then take the mean. This would report back on average to absolute difference between the critics rating versus the user rating.
TASK: Calculate the Mean Absolute Difference between RT scores and RT User scores as described above.
# CODE HEREall_sites['Rotten_Diff'].apply(abs).mean()15.095890410958905TASK: Plot the distribution of the differences between RT Critics Score and RT User Score. There should be negative values in this distribution plot. Feel free to use KDE or Histograms to display this distribution.
#CODE HEREplt.figure(figsize=(10,4),dpi=200)
sns.histplot(data=all_sites,x='Rotten_Diff',kde=True,bins=25)
plt.title("RT Critics Score minus RT User Score");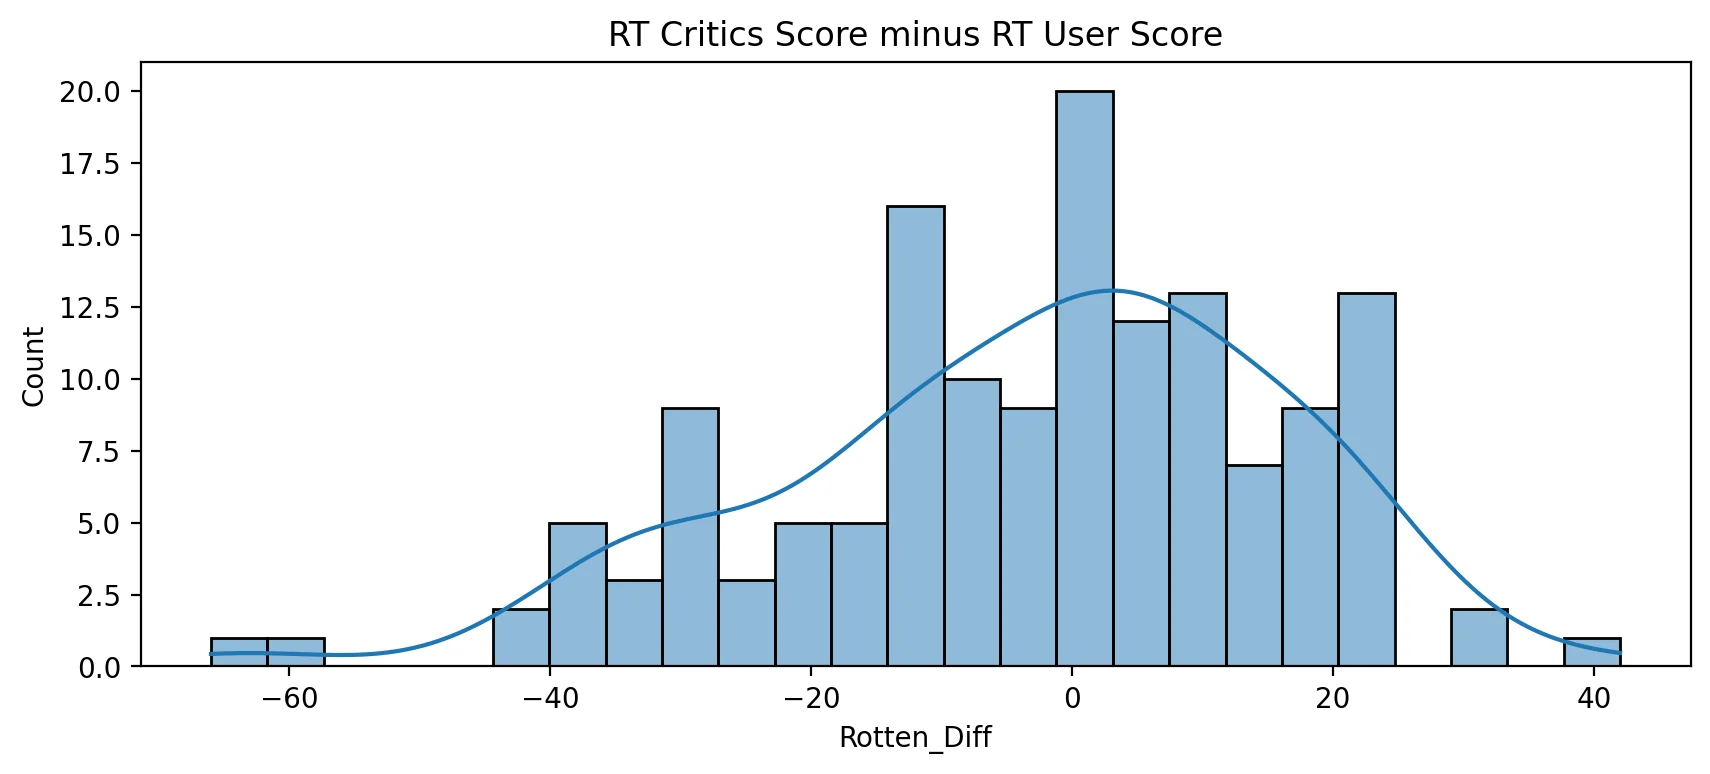
*TASK: Now create a distribution showing the absolute value difference between Critics and Users on Rotten Tomatoes.*
#CODE HEREplt.figure(figsize=(10,4),dpi=200)
sns.histplot(x=all_sites['Rotten_Diff'].apply(abs),bins=25,kde=True)
plt.title("Abs Difference between RT Critics Score and RT User Score");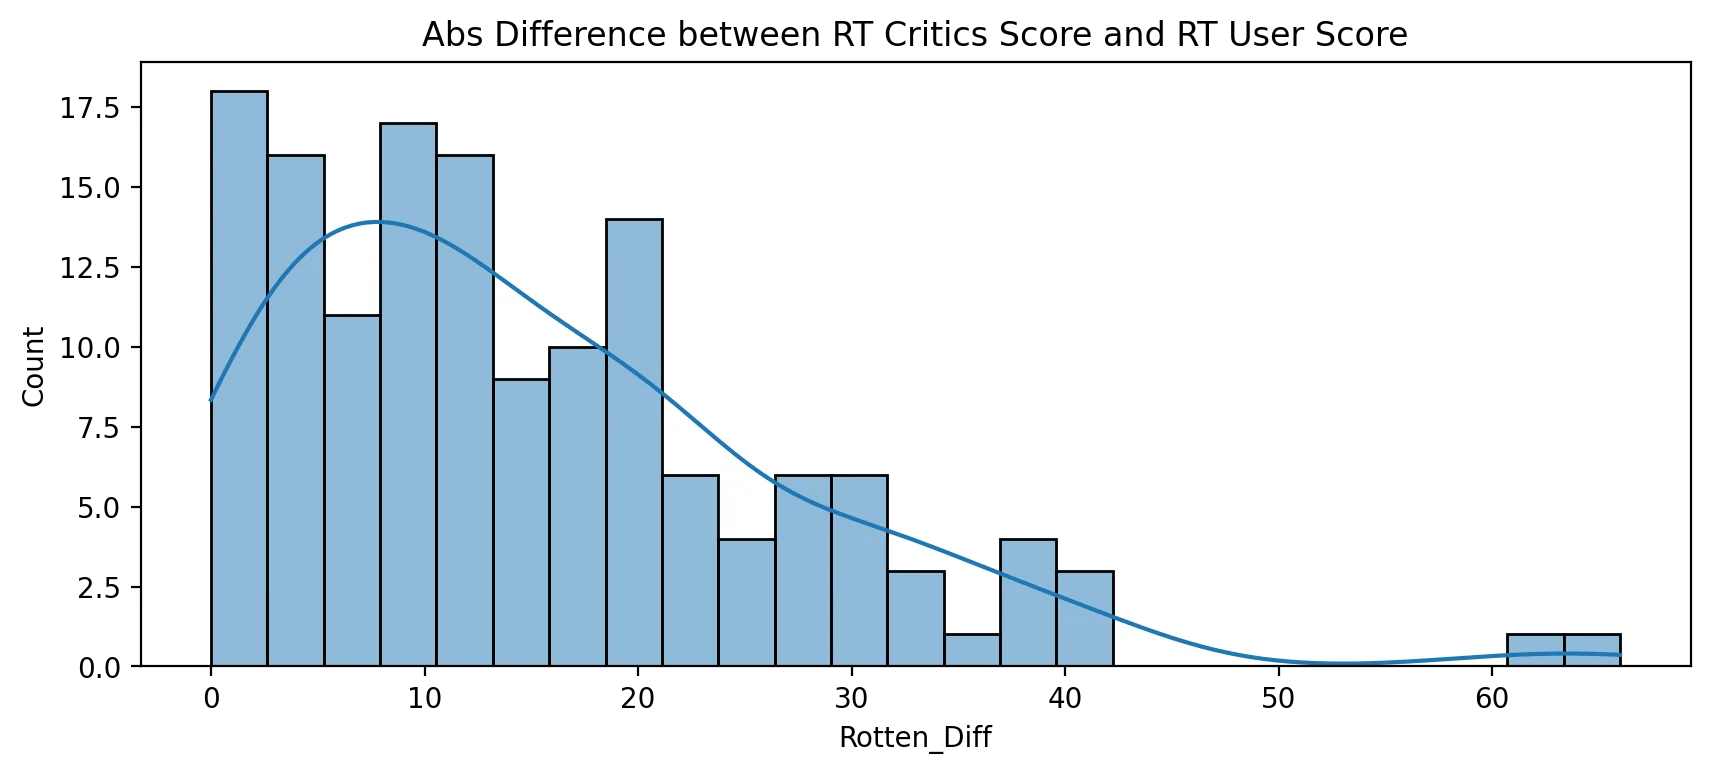
*Let's find out which movies are causing the largest differences. First, show the top 5 movies with the largest negative difference between Users and RT critics. Since we calculated the difference as Critics Rating - Users Rating, then large negative values imply the users rated the movie much higher on average than the critics did.*
TASK: What are the top 5 movies users rated higher than critics on average:
# CODE HEREprint("Users Love but Critics Hate")
all_sites.nsmallest(5,'Rotten_Diff')[['FILM','Rotten_Diff']]Users Love but Critics HateFILM
Rotten_Diff
3
Do You Believe? (2015)
-6612 more lines
85
Little Boy (2015)
-61
105
Hitman: Agent 47 (2015)
-42
134
The Longest Ride (2015)
-42
125
The Wedding Ringer (2015)
-39TASK: Now show the top 5 movies critics scores higher than users on average.
# CODE HEREprint("Critics love, but Users Hate")
all_sites.nlargest(5,'Rotten_Diff')[['FILM','Rotten_Diff']]Critics love, but Users HateFILM
Rotten_Diff
69
Mr. Turner (2014)
4212 more lines
112
It Follows (2015)
31
115
While We're Young (2015)
31
37
Welcome to Me (2015)
24
40
I'll See You In My Dreams (2015)
24MetaCritic
Now let's take a quick look at the ratings from MetaCritic. Metacritic also shows an average user rating versus their official displayed rating.
TASK: Display a scatterplot of the Metacritic Rating versus the Metacritic User rating.
# CODE HEREplt.figure(figsize=(10,4),dpi=150)
sns.scatterplot(data=all_sites,x='Metacritic',y='Metacritic_User')
plt.xlim(0,100)
plt.ylim(0,10)(0.0, 10.0)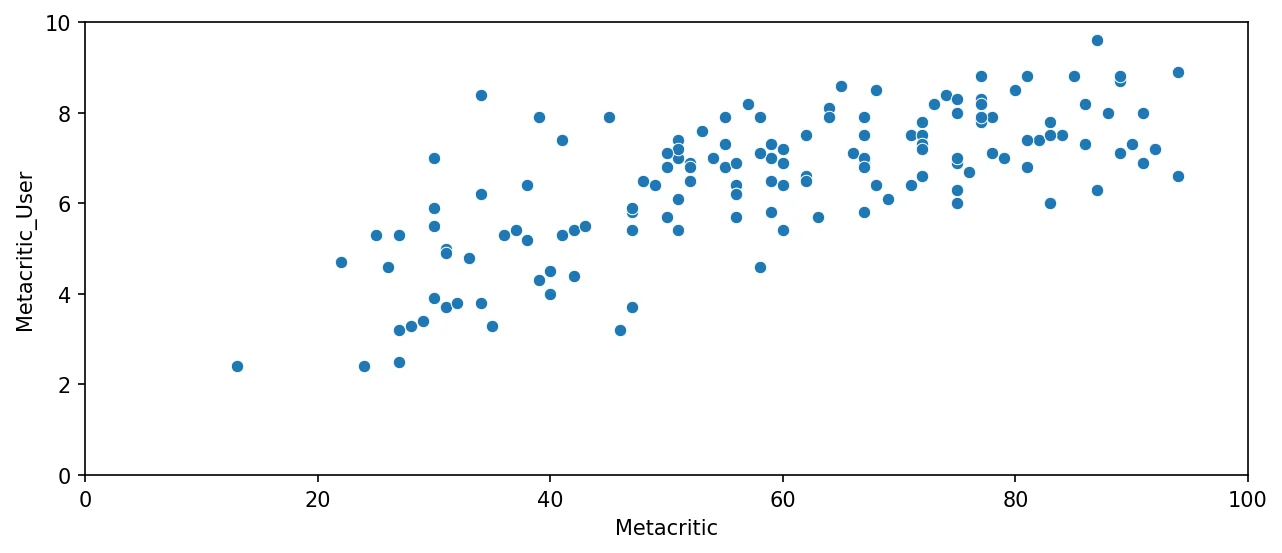
IMBD
Finally let's explore IMDB. Notice that both Metacritic and IMDB report back vote counts. Let's analyze the most popular movies.
TASK: Create a scatterplot for the relationship between vote counts on MetaCritic versus vote counts on IMDB.
#CODE HEREplt.figure(figsize=(10,4),dpi=150)
sns.scatterplot(data=all_sites,x='Metacritic_user_vote_count',y='IMDB_user_vote_count')<AxesSubplot:xlabel='Metacritic_user_vote_count', ylabel='IMDB_user_vote_count'>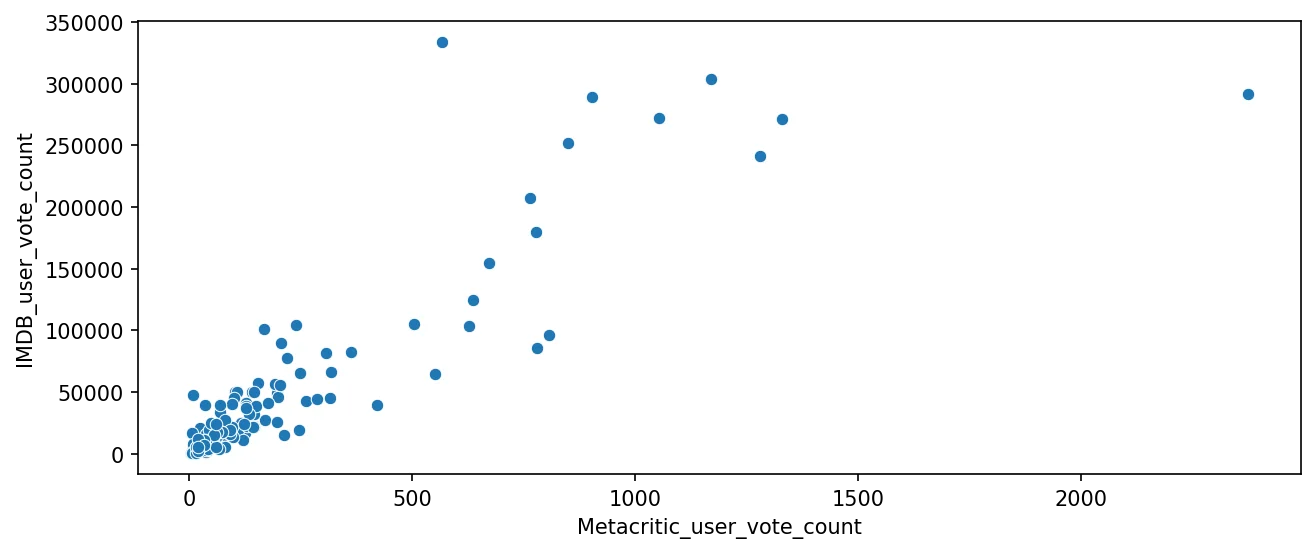
Notice there are two outliers here. The movie with the highest vote count on IMDB only has about 500 Metacritic ratings. What is this movie?
TASK: What movie has the highest IMDB user vote count?
#CODE HEREall_sites.nlargest(1,'IMDB_user_vote_count')FILM
RottenTomatoes
RottenTomatoes_User
Metacritic
Metacritic_User14 more lines
IMDB
Metacritic_user_vote_count
IMDB_user_vote_count
Rotten_Diff
14
The Imitation Game (2014)
90
92
73
8.2
8.1
566
334164
-2TASK: What movie has the highest Metacritic User Vote count?
#CODE HEREall_sites.nlargest(1,'Metacritic_user_vote_count')FILM
RottenTomatoes
RottenTomatoes_User
Metacritic
Metacritic_User14 more lines
IMDB
Metacritic_user_vote_count
IMDB_user_vote_count
Rotten_Diff
88
Mad Max: Fury Road (2015)
97
88
89
8.7
8.3
2375
292023
9Fandago Scores vs. All Sites
Finally let's begin to explore whether or not Fandango artificially displays higher ratings than warranted to boost ticket sales.
*TASK: Combine the Fandango Table with the All Sites table. Not every movie in the Fandango table is in the All Sites table, since some Fandango movies have very little or no reviews. We only want to compare movies that are in both DataFrames, so do an inner merge to merge together both DataFrames based on the FILM columns.*
#CODE HEREdf = pd.merge(fandango,all_sites,on='FILM',how='inner')df.info()<class 'pandas.core.frame.DataFrame'>
Int64Index: 145 entries, 0 to 144
Data columns (total 13 columns):
# Column Non-Null Count Dtype
--- ------ -------------- ----- 15 more lines
0 FILM 145 non-null object
1 STARS 145 non-null float64
2 RATING 145 non-null float64
3 VOTES 145 non-null int64
4 YEAR 145 non-null object
5 RottenTomatoes 145 non-null int64
6 RottenTomatoes_User 145 non-null int64
7 Metacritic 145 non-null int64
8 Metacritic_User 145 non-null float64
9 IMDB 145 non-null float64
10 Metacritic_user_vote_count 145 non-null int64
11 IMDB_user_vote_count 145 non-null int64
12 Rotten_Diff 145 non-null int64
dtypes: float64(4), int64(7), object(2)
memory usage: 15.9+ KBdf.head()FILM
STARS
RATING
VOTES
YEAR78 more lines
RottenTomatoes
RottenTomatoes_User
Metacritic
Metacritic_User
IMDB
Metacritic_user_vote_count
IMDB_user_vote_count
Rotten_Diff
0
Fifty Shades of Grey (2015)
4.0
3.9
34846
2015
25
42
46
3.2
4.2
778
179506
-17
1
Jurassic World (2015)
4.5
4.5
34390
2015
71
81
59
7.0
7.3
1281
241807
-10
2
American Sniper (2015)
5.0
4.8
34085
2015
72
85
72
6.6
7.4
850
251856
-13
3
Furious 7 (2015)
5.0
4.8
33538
2015
81
84
67
6.8
7.4
764
207211
-3
4
Inside Out (2015)
4.5
4.5
15749
2015
98
90
94
8.9
8.6
807
96252
8Normalize columns to Fandango STARS and RATINGS 0-5
Notice that RT,Metacritic, and IMDB don't use a score between 0-5 stars like Fandango does. In order to do a fair comparison, we need to normalize these values so they all fall between 0-5 stars and the relationship between reviews stays the same.
TASK: Create new normalized columns for all ratings so they match up within the 0-5 star range shown on Fandango. There are many ways to do this.
Hint link: https://stackoverflow.com/questions/26414913/normalize-columns-of-pandas-data-frame
Easier Hint:
Keep in mind, a simple way to convert ratings:
- 100/20 = 5
- 10/2 = 5
# CODE HERE# Dont run this cell multiple times, otherwise you keep dividing!
df['RT_Norm'] = np.round(df['RottenTomatoes']/20,1)
df['RTU_Norm'] = np.round(df['RottenTomatoes_User']/20,1)# Dont run this cell multiple times, otherwise you keep dividing!
df['Meta_Norm'] = np.round(df['Metacritic']/20,1)
df['Meta_U_Norm'] = np.round(df['Metacritic_User']/2,1)# Dont run this cell multiple times, otherwise you keep dividing!
df['IMDB_Norm'] = np.round(df['IMDB']/2,1)df.head()FILM
STARS
RATING
VOTES
YEAR108 more lines
RottenTomatoes
RottenTomatoes_User
Metacritic
Metacritic_User
IMDB
Metacritic_user_vote_count
IMDB_user_vote_count
Rotten_Diff
RT_Norm
RTU_Norm
Meta_Norm
Meta_U_Norm
IMDB_Norm
0
Fifty Shades of Grey (2015)
4.0
3.9
34846
2015
25
42
46
3.2
4.2
778
179506
-17
1.2
2.1
2.3
1.6
2.1
1
Jurassic World (2015)
4.5
4.5
34390
2015
71
81
59
7.0
7.3
1281
241807
-10
3.6
4.0
3.0
3.5
3.6
2
American Sniper (2015)
5.0
4.8
34085
2015
72
85
72
6.6
7.4
850
251856
-13
3.6
4.2
3.6
3.3
3.7
3
Furious 7 (2015)
5.0
4.8
33538
2015
81
84
67
6.8
7.4
764
207211
-3
4.0
4.2
3.4
3.4
3.7
4
Inside Out (2015)
4.5
4.5
15749
2015
98
90
94
8.9
8.6
807
96252
8
4.9
4.5
4.7
4.4
4.3
TASK: Now create a norm_scores DataFrame that only contains the normalizes ratings. Include both STARS and RATING from the original Fandango table.
#CODE HEREnorm_scores = df[['STARS','RATING','RT_Norm','RTU_Norm','Meta_Norm','Meta_U_Norm','IMDB_Norm']]norm_scores.head()STARS
RATING
RT_Norm
RTU_Norm
Meta_Norm42 more lines
Meta_U_Norm
IMDB_Norm
0
4.0
3.9
1.2
2.1
2.3
1.6
2.1
1
4.5
4.5
3.6
4.0
3.0
3.5
3.6
2
5.0
4.8
3.6
4.2
3.6
3.3
3.7
3
5.0
4.8
4.0
4.2
3.4
3.4
3.7
4
4.5
4.5
4.9
4.5
4.7
4.4
4.3
Comparing Distribution of Scores Across Sites
Now the moment of truth! Does Fandango display abnormally high ratings? We already know it pushs displayed RATING higher than STARS, but are the ratings themselves higher than average?
TASK: Create a plot comparing the distributions of normalized ratings across all sites. There are many ways to do this, but explore the Seaborn KDEplot docs for some simple ways to quickly show this. Don't worry if your plot format does not look exactly the same as ours, as long as the differences in distribution are clear.
Quick Note if you have issues moving the legend for a seaborn kdeplot: https://github.com/mwaskom/seaborn/issues/2280
#CODE HEREdef move_legend(ax, new_loc, **kws):
old_legend = ax.legend_
handles = old_legend.legendHandles
labels = [t.get_text() for t in old_legend.get_texts()]
title = old_legend.get_title().get_text()
ax.legend(handles, labels, loc=new_loc, title=title, **kws)fig, ax = plt.subplots(figsize=(15,6),dpi=150)
sns.kdeplot(data=norm_scores,clip=[0,5],shade=True,palette='Set1',ax=ax)
move_legend(ax, "upper left")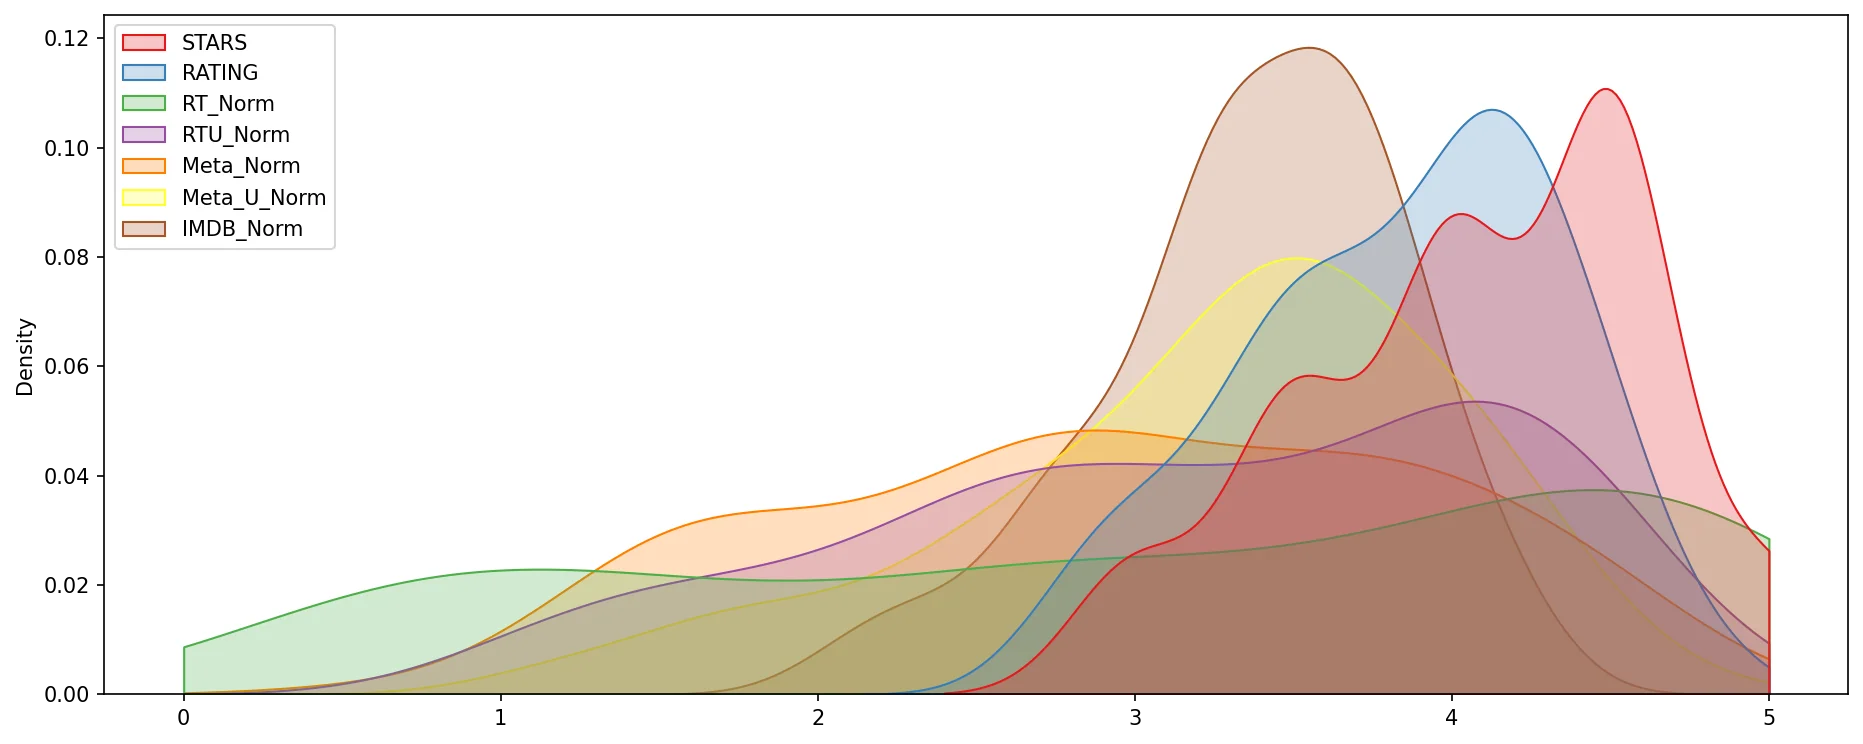
Clearly Fandango has an uneven distribution. We can also see that RT critics have the most uniform distribution. Let's directly compare these two.
TASK: Create a KDE plot that compare the distribution of RT critic ratings against the STARS displayed by Fandango.
#CODE HEREfig, ax = plt.subplots(figsize=(15,6),dpi=150)
sns.kdeplot(data=norm_scores[['RT_Norm','STARS']],clip=[0,5],shade=True,palette='Set1',ax=ax)
move_legend(ax, "upper left")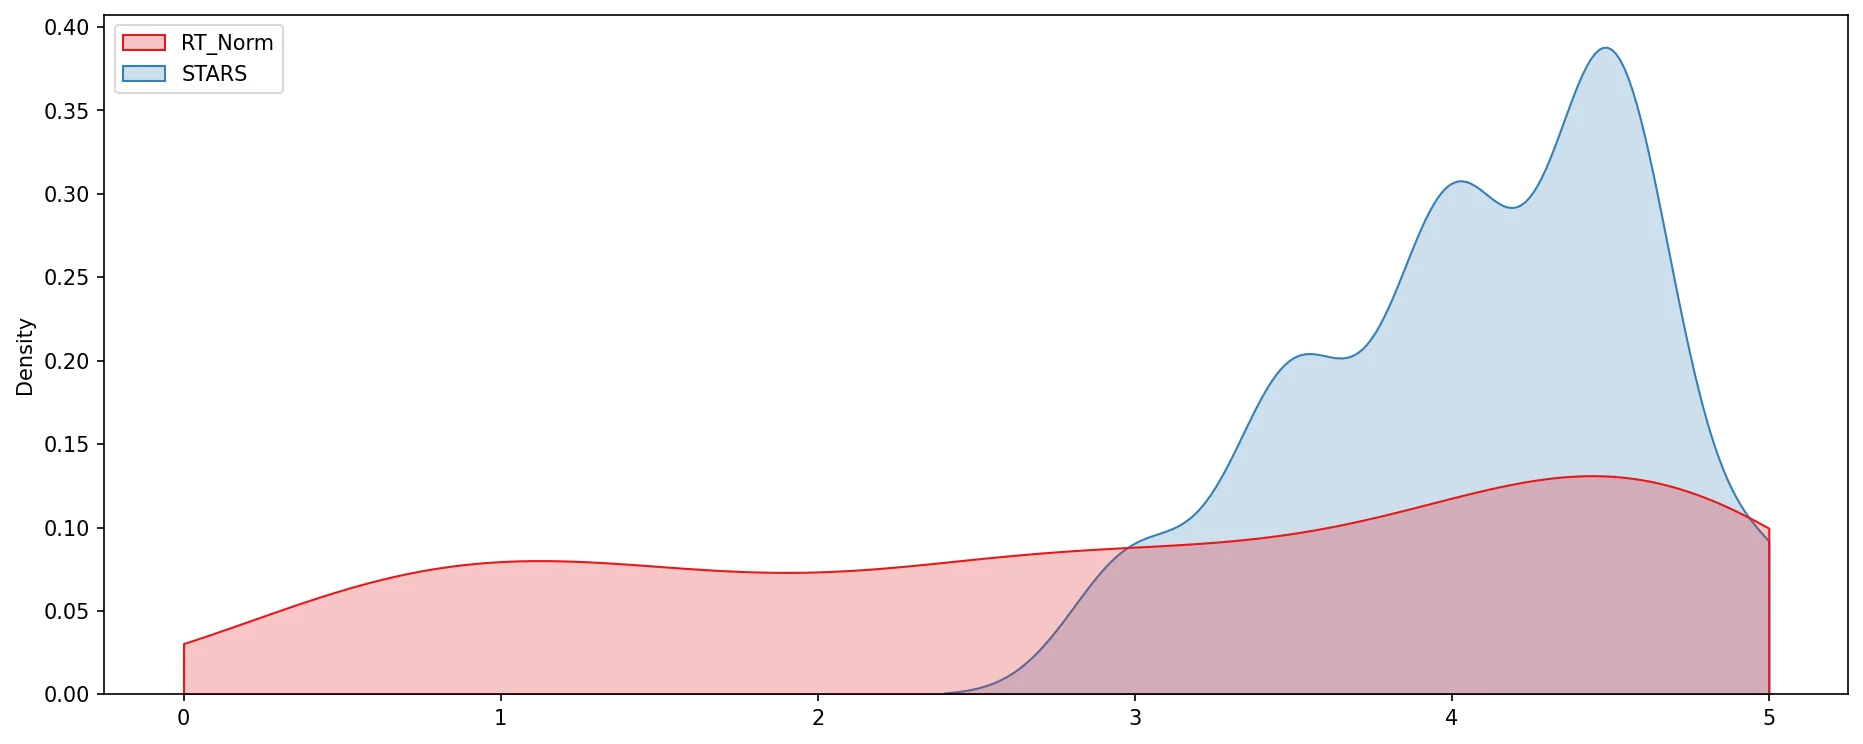
OPTIONAL TASK: Create a histplot comparing all normalized scores.
#CODE HEREplt.subplots(figsize=(15,6),dpi=150)
sns.histplot(norm_scores,bins=50)<AxesSubplot:ylabel='Count'>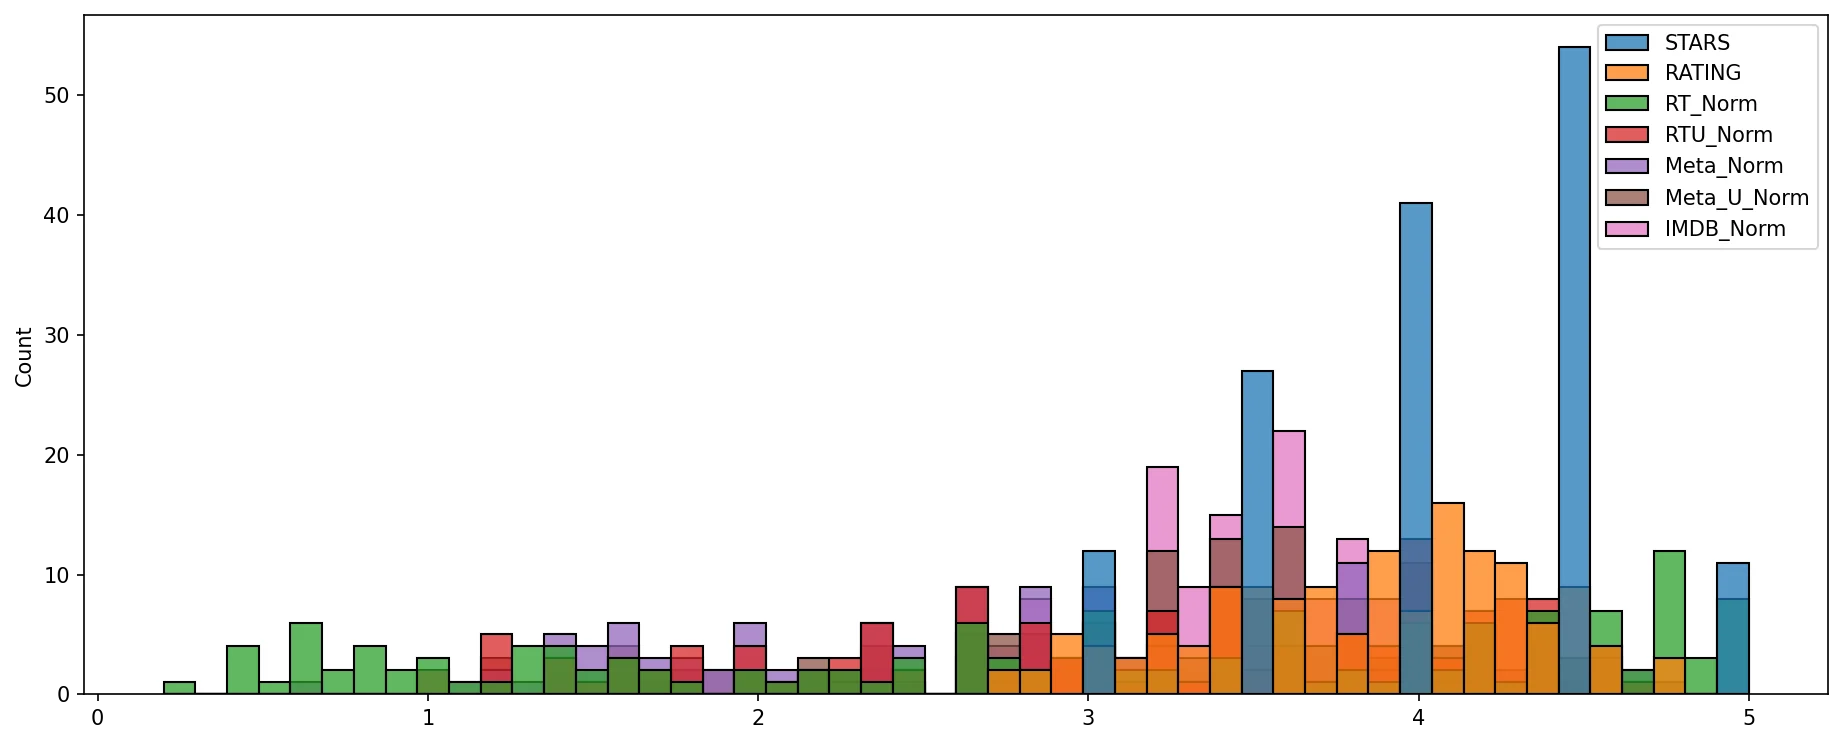
How are the worst movies rated across all platforms?
TASK: Create a clustermap visualization of all normalized scores. Note the differences in ratings, highly rated movies should be clustered together versus poorly rated movies. Note: This clustermap does not need to have the FILM titles as the index, feel free to drop it for the clustermap.
# CODE HEREsns.clustermap(norm_scores,cmap='magma',col_cluster=False)<seaborn.matrix.ClusterGrid at 0x1aa7cb2b548>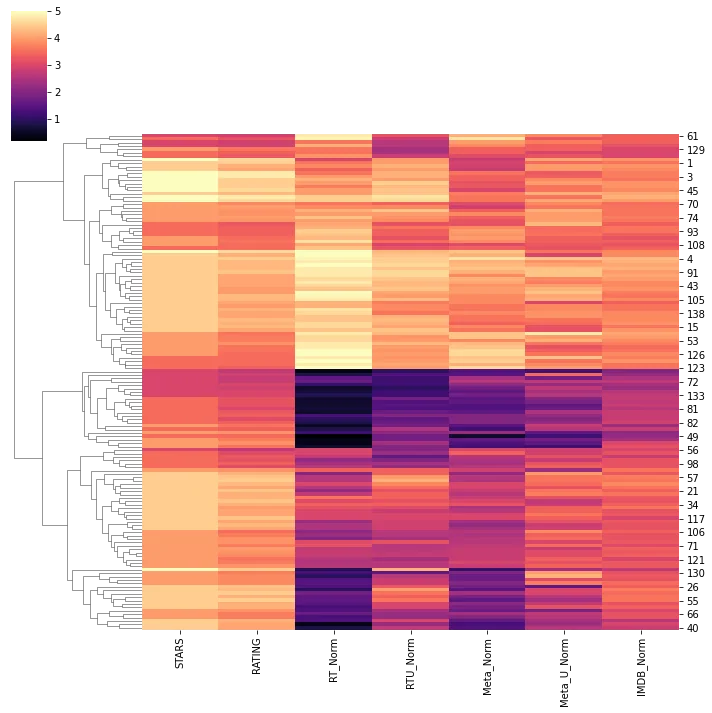
TASK: Clearly Fandango is rating movies much higher than other sites, especially considering that it is then displaying a rounded up version of the rating. Let's examine the top 10 worst movies. Based off the Rotten Tomatoes Critic Ratings, what are the top 10 lowest rated movies? What are the normalized scores across all platforms for these movies? You may need to add the FILM column back in to your DataFrame of normalized scores to see the results.
# CODE HEREnorm_films = df[['STARS','RATING','RT_Norm','RTU_Norm','Meta_Norm','Meta_U_Norm','IMDB_Norm','FILM']]norm_films.nsmallest(10,'RT_Norm')STARS
RATING
RT_Norm
RTU_Norm
Meta_Norm93 more lines
Meta_U_Norm
IMDB_Norm
FILM
49
3.5
3.5
0.2
1.8
0.6
1.2
2.2
Paul Blart: Mall Cop 2 (2015)
25
4.5
4.1
0.4
2.3
1.3
2.3
3.0
Taken 3 (2015)
28
3.0
2.7
0.4
1.0
1.4
1.2
2.0
Fantastic Four (2015)
54
4.0
3.7
0.4
1.8
1.6
1.8
2.4
Hot Pursuit (2015)
84
4.0
3.9
0.4
2.4
1.4
1.6
3.0
Hitman: Agent 47 (2015)
50
4.0
3.6
0.5
1.8
1.5
2.8
2.3
The Boy Next Door (2015)
77
3.5
3.2
0.6
1.8
1.5
2.0
2.8
Seventh Son (2015)
78
3.5
3.2
0.6
1.5
1.4
1.6
2.8
Mortdecai (2015)
83
3.5
3.3
0.6
1.7
1.6
2.5
2.8
Sinister 2 (2015)
87
3.5
3.2
0.6
1.4
1.6
1.9
2.7
Unfinished Business (2015)
FINAL TASK: Visualize the distribution of ratings across all sites for the top 10 worst movies.
# CODE HEREprint('\n\n')
plt.figure(figsize=(15,6),dpi=150)
worst_films = norm_films.nsmallest(10,'RT_Norm').drop('FILM',axis=1)
sns.kdeplot(data=worst_films,clip=[0,5],shade=True,palette='Set1')
plt.title("Ratings for RT Critic's 10 Worst Reviewed Films");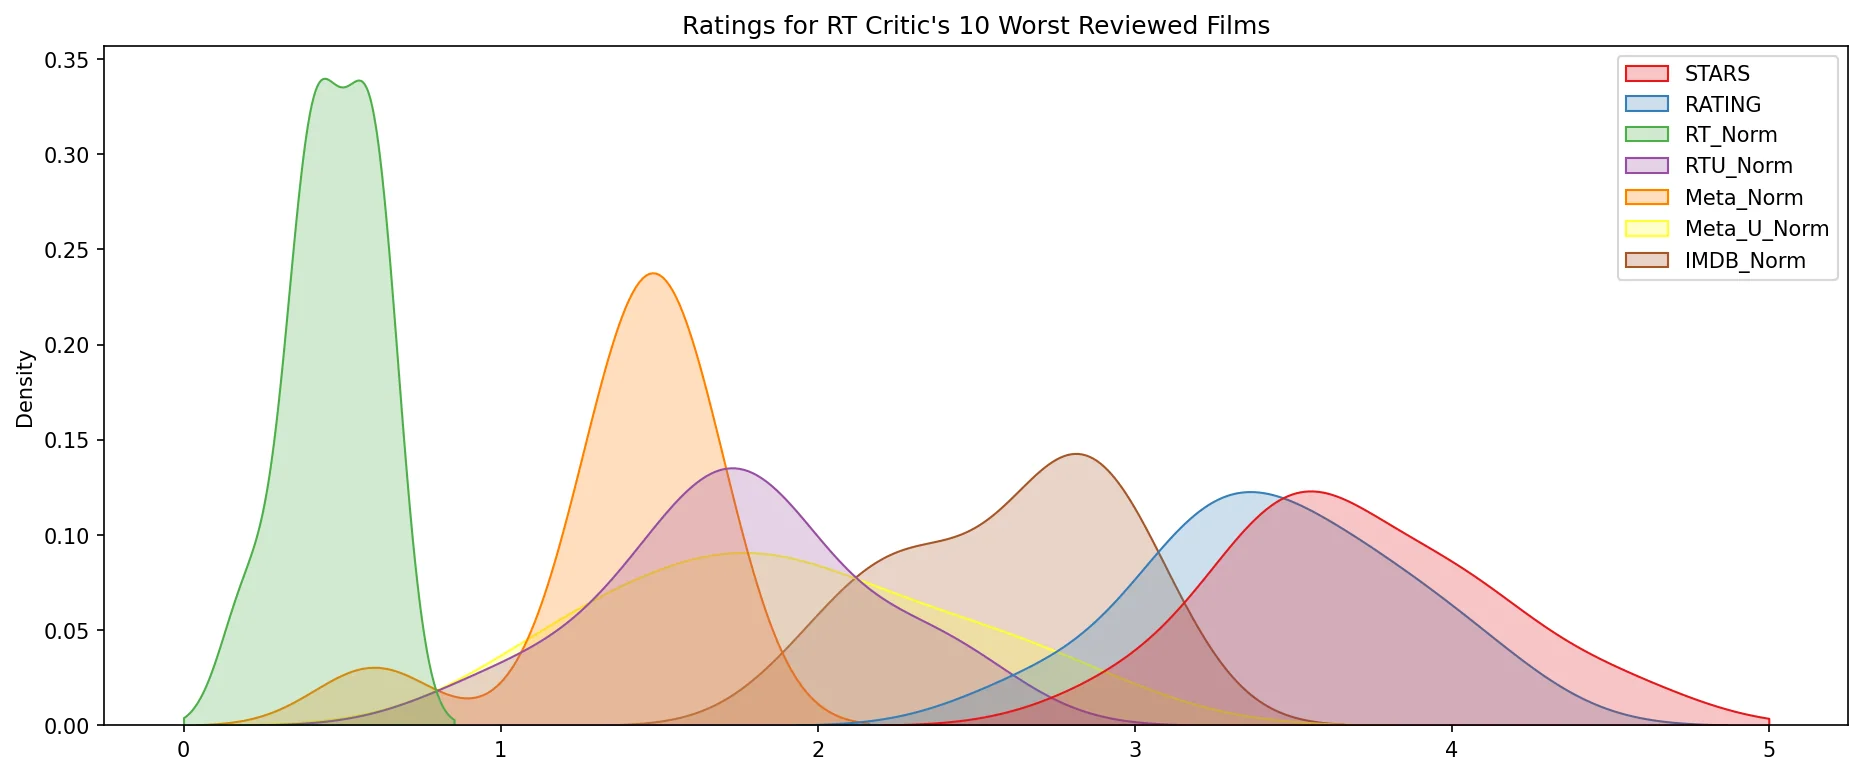

Final thoughts: Wow! Fandango is showing around 3-4 star ratings for films that are clearly bad! Notice the biggest offender, Taken 3!. Fandango is displaying 4.5 stars on their site for a film with an average rating of 1.86 across the other platforms!
norm_films.iloc[25]STARS 4.5
RATING 4.1
RT_Norm 0.4
RTU_Norm 2.3
Meta_Norm 1.34 more lines
Meta_U_Norm               2.3
IMDB_Norm                   3
FILM           Taken 3 (2015)
Name: 25, dtype: object0.4+2.3+1.3+2.3+39.39.3/51.86