AdaBoost
The Data
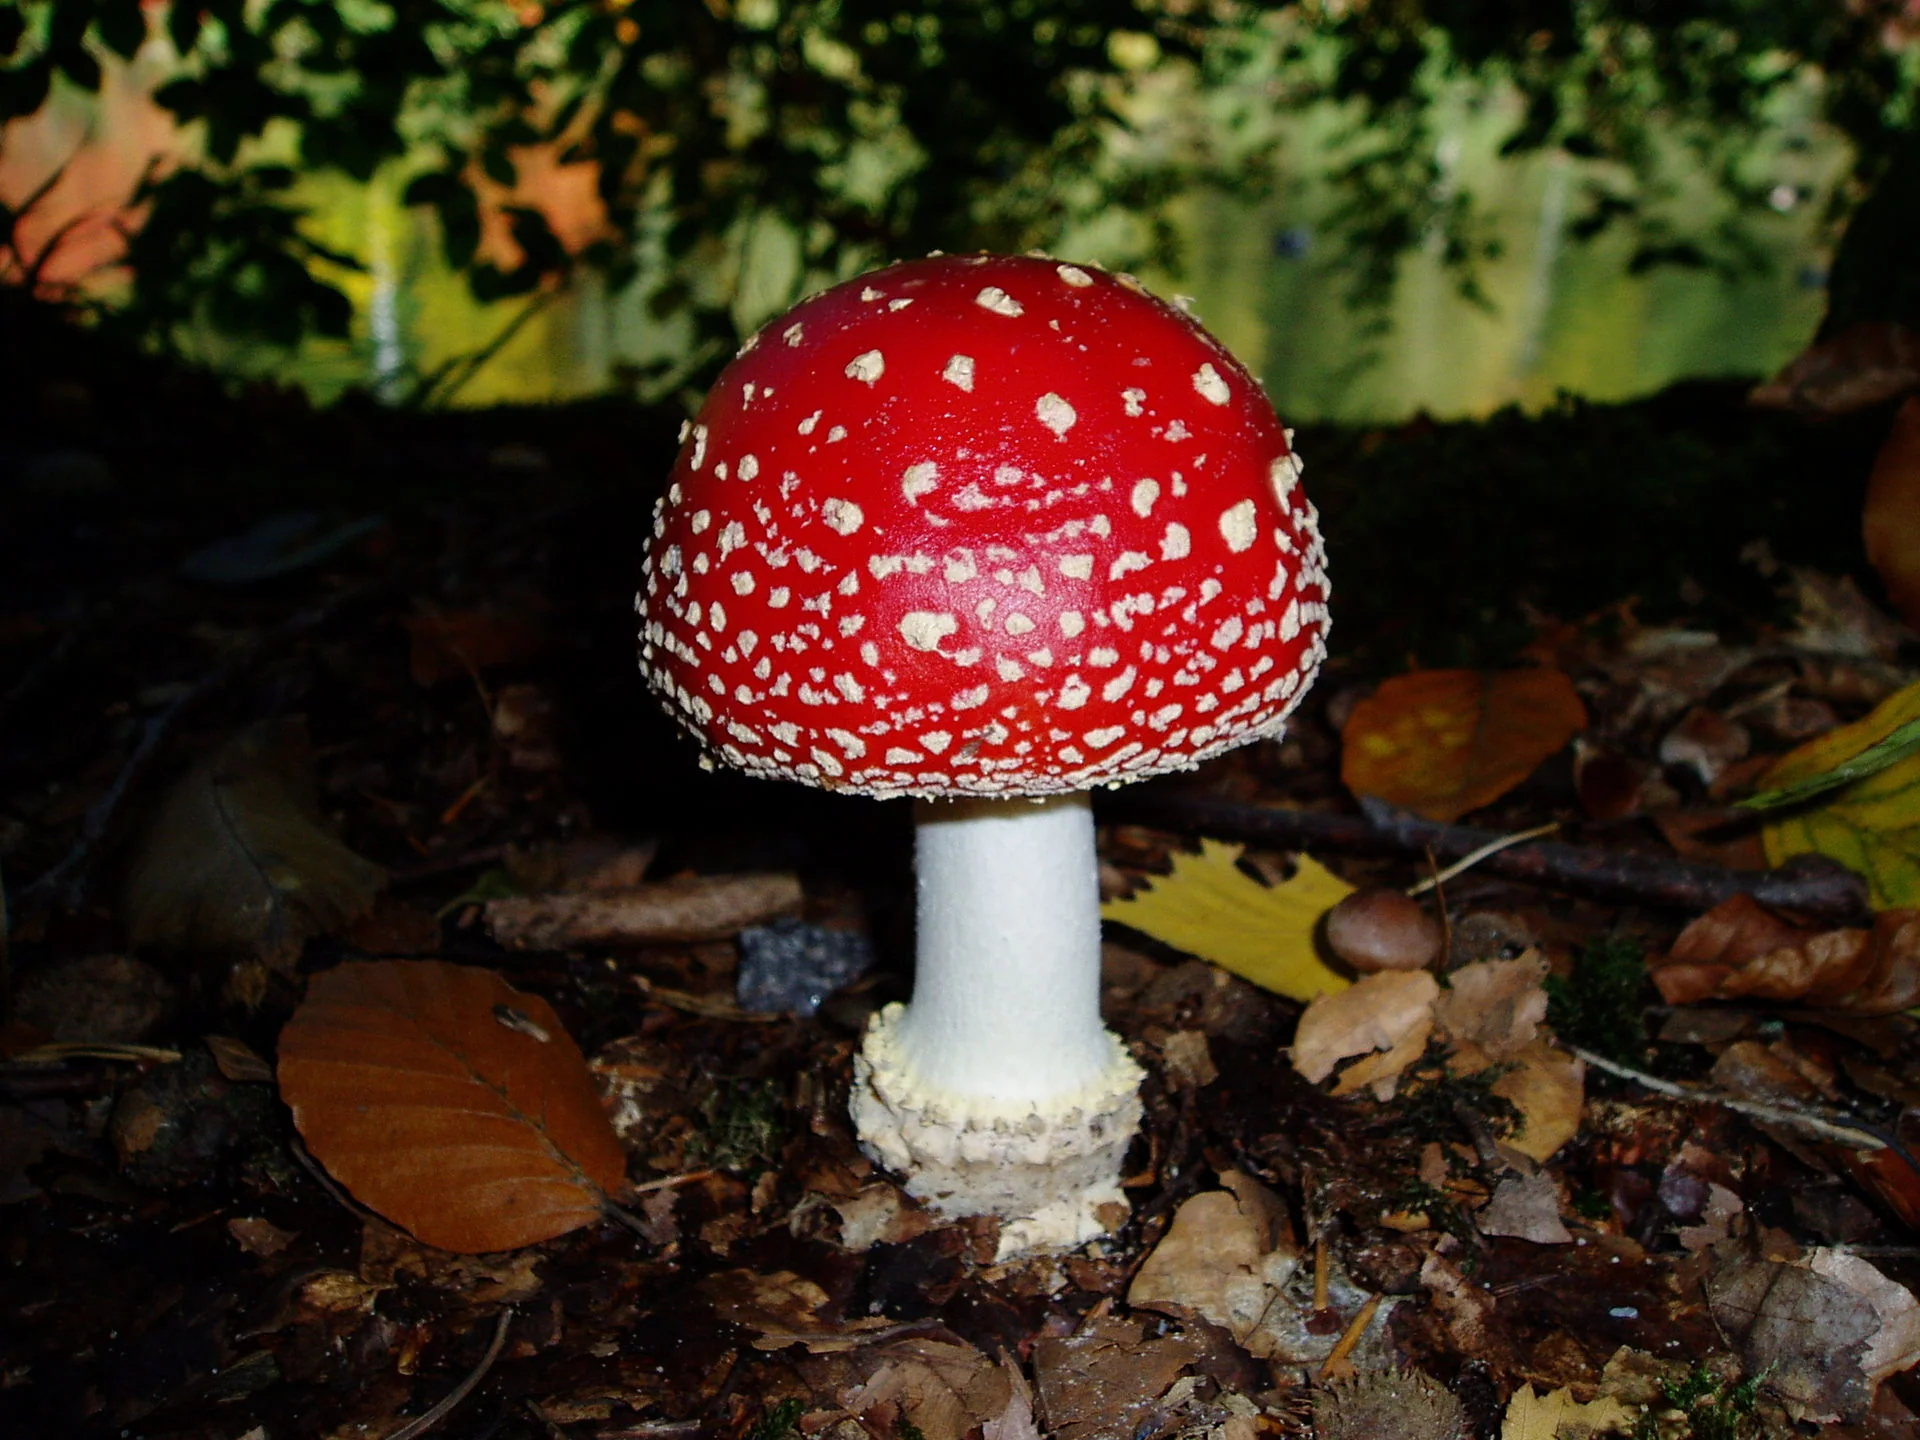
Mushroom Hunting: Edible or Poisonous?
Data Source: https://archive.ics.uci.edu/ml/datasets/Mushroom
This data set includes descriptions of hypothetical samples corresponding to 23 species of gilled mushrooms in the Agaricus and Lepiota Family (pp. 500-525). Each species is identified as definitely edible, definitely poisonous, or of unknown edibility and not recommended. This latter class was combined with the poisonous one. The Guide clearly states that there is no simple rule for determining the edibility of a mushroom; no rule like ``leaflets three, let it be'' for Poisonous Oak and Ivy.
Attribute Information:
- cap-shape: bell=b,conical=c,convex=x,flat=f, knobbed=k,sunken=s
- cap-surface: fibrous=f,grooves=g,scaly=y,smooth=s
- cap-color: brown=n,buff=b,cinnamon=c,gray=g,green=r, pink=p,purple=u,red=e,white=w,yellow=y
- bruises?: bruises=t,no=f
- odor: almond=a,anise=l,creosote=c,fishy=y,foul=f, musty=m,none=n,pungent=p,spicy=s
- gill-attachment: attached=a,descending=d,free=f,notched=n
- gill-spacing: close=c,crowded=w,distant=d
- gill-size: broad=b,narrow=n
- gill-color: black=k,brown=n,buff=b,chocolate=h,gray=g, green=r,orange=o,pink=p,purple=u,red=e, white=w,yellow=y
- stalk-shape: enlarging=e,tapering=t
- stalk-root: bulbous=b,club=c,cup=u,equal=e, rhizomorphs=z,rooted=r,missing=?
- stalk-surface-above-ring: fibrous=f,scaly=y,silky=k,smooth=s
- stalk-surface-below-ring: fibrous=f,scaly=y,silky=k,smooth=s
- stalk-color-above-ring: brown=n,buff=b,cinnamon=c,gray=g,orange=o, pink=p,red=e,white=w,yellow=y
- stalk-color-below-ring: brown=n,buff=b,cinnamon=c,gray=g,orange=o, pink=p,red=e,white=w,yellow=y
- veil-type: partial=p,universal=u
- veil-color: brown=n,orange=o,white=w,yellow=y
- ring-number: none=n,one=o,two=t
- ring-type: cobwebby=c,evanescent=e,flaring=f,large=l, none=n,pendant=p,sheathing=s,zone=z
- spore-print-color: black=k,brown=n,buff=b,chocolate=h,green=r, orange=o,purple=u,white=w,yellow=y
- population: abundant=a,clustered=c,numerous=n, scattered=s,several=v,solitary=y
- habitat: grasses=g,leaves=l,meadows=m,paths=p, urban=u,waste=w,woods=d
Goal
THIS IS IMPORTANT, THIS IS NOT OUR TYPICAL PREDICTIVE MODEL!
Our general goal here is to see if we can harness the power of machine learning and boosting to help create not just a predictive model, but a general guideline for features people should look out for when picking mushrooms.
Imports
df = pd.read_csv("../DATA/mushrooms.csv")df.head()class
cap-shape
cap-surface
cap-color
bruises127 more lines
odor
gill-attachment
gill-spacing
gill-size
gill-color
...
stalk-surface-below-ring
stalk-color-above-ring
stalk-color-below-ring
veil-type
veil-color
ring-number
ring-type
spore-print-color
population
habitat
0
p
x
s
n
t
p
f
c
n
k
...
s
w
w
p
w
o
p
k
s
u
1
e
x
s
y
t
a
f
c
b
k
...
s
w
w
p
w
o
p
n
n
g
2
e
b
s
w
t
l
f
c
b
n
...
s
w
w
p
w
o
p
n
n
m
3
p
x
y
w
t
p
f
c
n
n
...
s
w
w
p
w
o
p
k
s
u
4
e
x
s
g
f
n
f
w
b
k
...
s
w
w
p
w
o
e
n
a
g
5 rows × 23 columns
EDA
sns.countplot(data=df,x='class')<AxesSubplot:xlabel='class', ylabel='count'>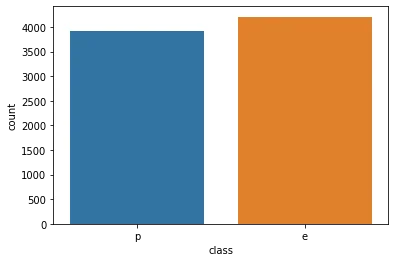
df.describe()class
cap-shape
cap-surface
cap-color
bruises105 more lines
odor
gill-attachment
gill-spacing
gill-size
gill-color
...
stalk-surface-below-ring
stalk-color-above-ring
stalk-color-below-ring
veil-type
veil-color
ring-number
ring-type
spore-print-color
population
habitat
count
8124
8124
8124
8124
8124
8124
8124
8124
8124
8124
...
8124
8124
8124
8124
8124
8124
8124
8124
8124
8124
unique
2
6
4
10
2
9
2
2
2
12
...
4
9
9
1
4
3
5
9
6
7
top
e
x
y
n
f
n
f
c
b
b
...
s
w
w
p
w
o
p
w
v
d
freq
4208
3656
3244
2284
4748
3528
7914
6812
5612
1728
...
4936
4464
4384
8124
7924
7488
3968
2388
4040
3148
4 rows × 23 columnsdf.describe().transpose()count
unique
top
freq
class114 more lines
8124
2
e
4208
cap-shape
8124
6
x
3656
cap-surface
8124
4
y
3244
cap-color
8124
10
n
2284
bruises
8124
2
f
4748
odor
8124
9
n
3528
gill-attachment
8124
2
f
7914
gill-spacing
8124
2
c
6812
gill-size
8124
2
b
5612
gill-color
8124
12
b
1728
stalk-shape
8124
2
t
4608
stalk-root
8124
5
b
3776
stalk-surface-above-ring
8124
4
s
5176
stalk-surface-below-ring
8124
4
s
4936
stalk-color-above-ring
8124
9
w
4464
stalk-color-below-ring
8124
9
w
4384
veil-type
8124
1
p
8124
veil-color
8124
4
w
7924
ring-number
8124
3
o
7488
ring-type
8124
5
p
3968
spore-print-color
8124
9
w
2388
population
8124
6
v
4040
habitat
8124
7
d
3148plt.figure(figsize=(14,6),dpi=200)
sns.barplot(data=df.describe().transpose().reset_index().sort_values('unique'),x='index',y='unique')
plt.xticks(rotation=90);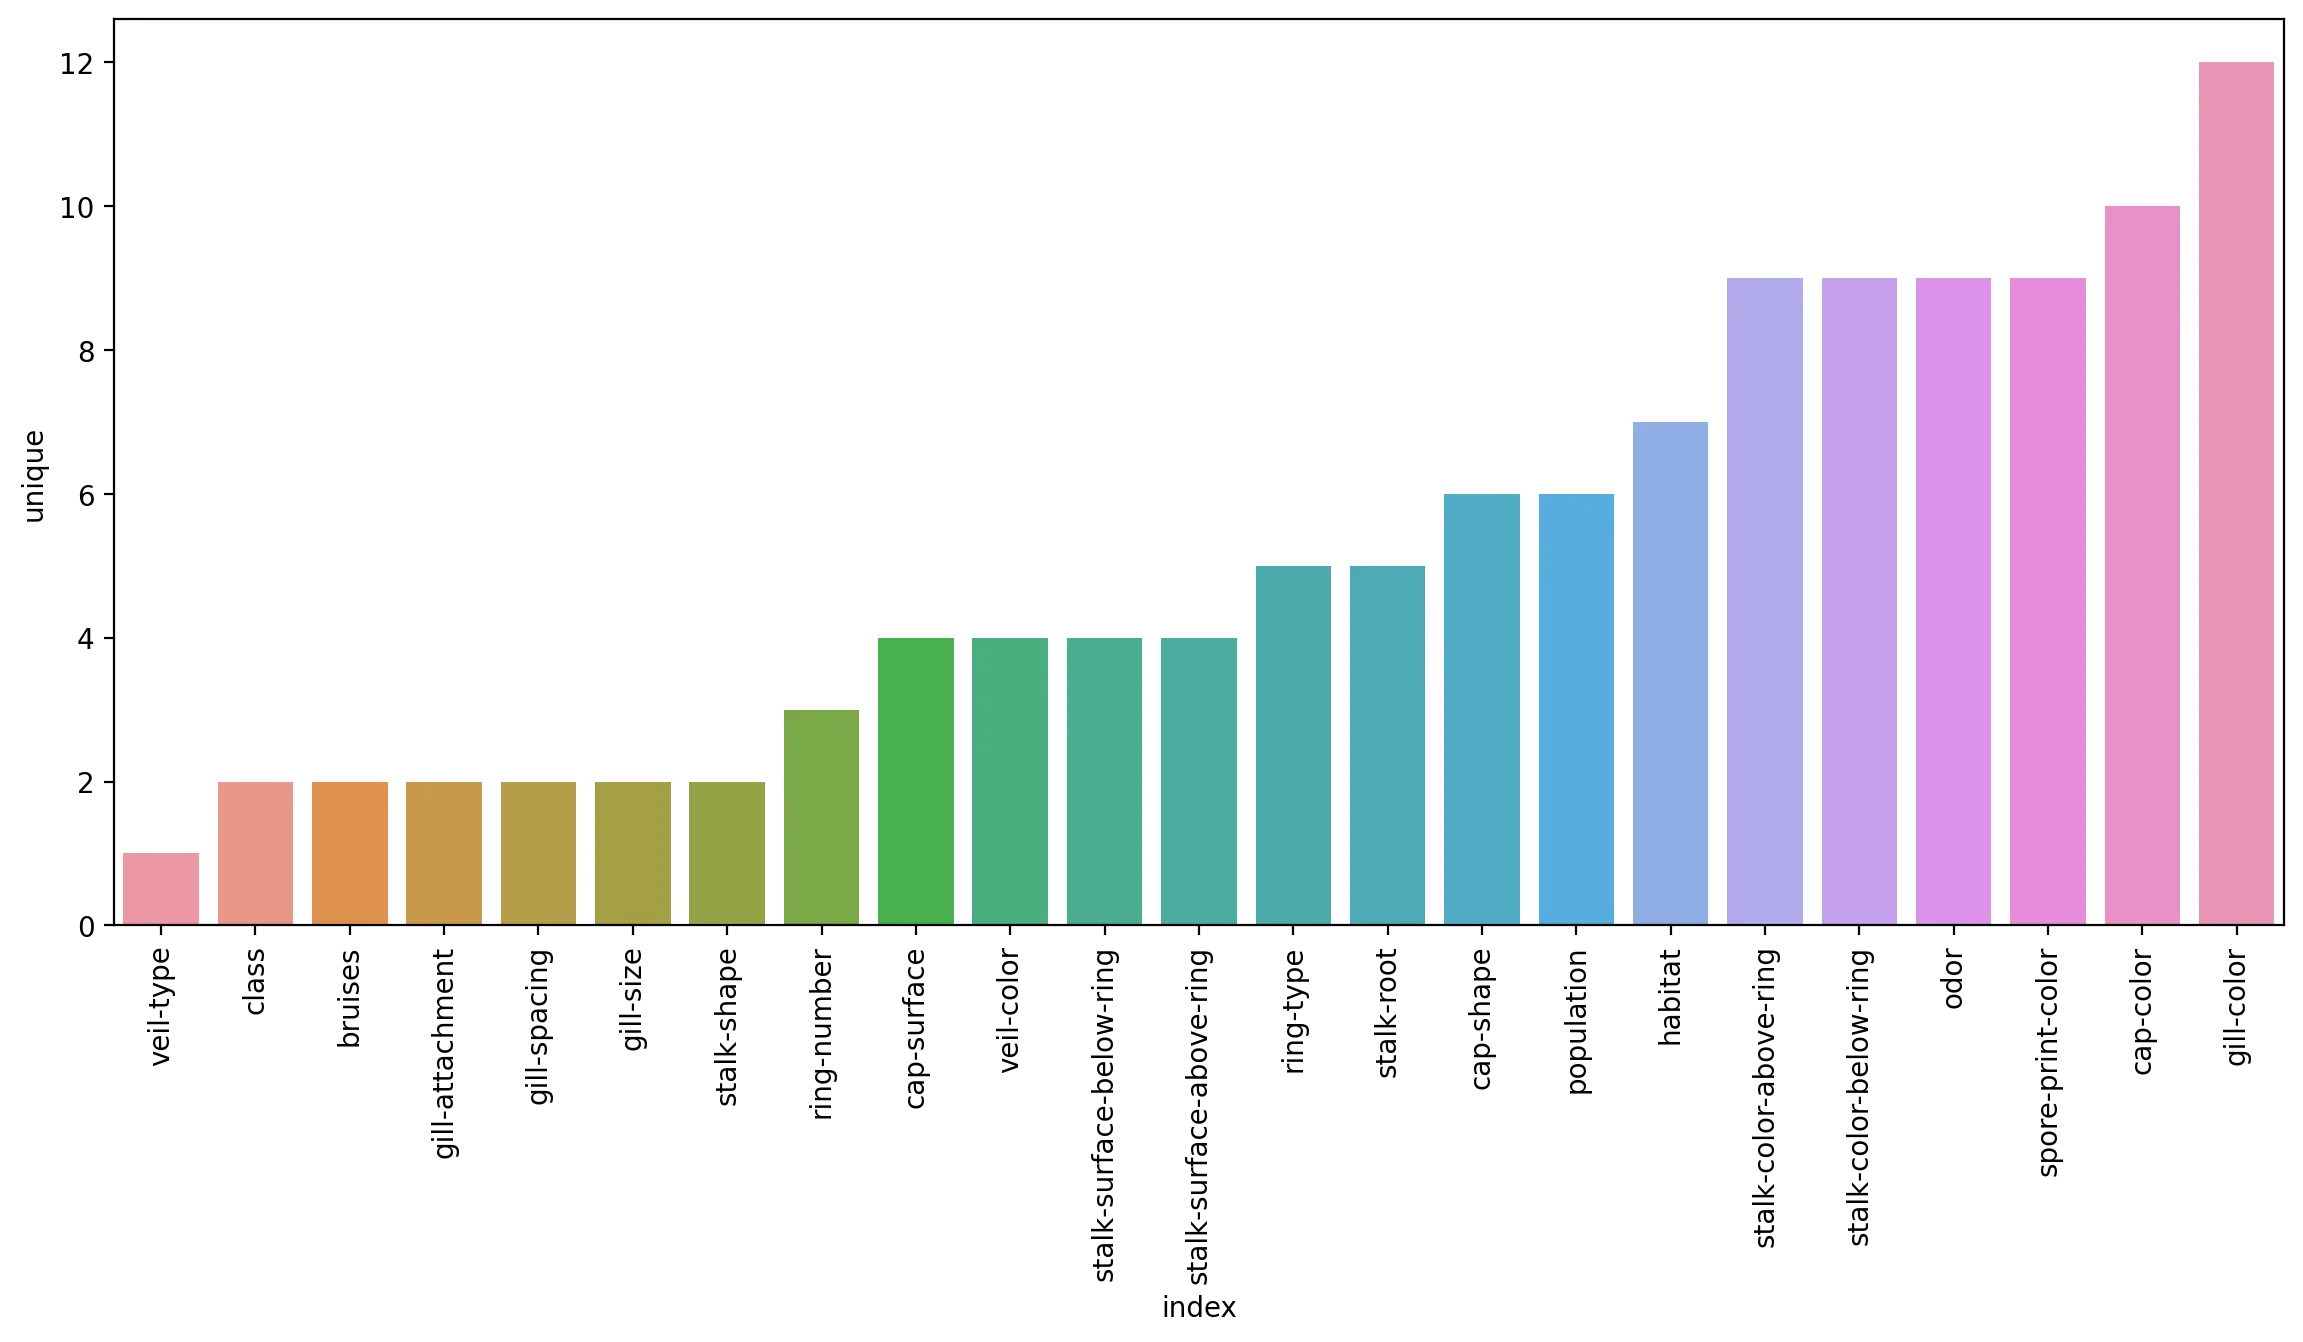
Train Test Split
X = df.drop('class',axis=1)X = pd.get_dummies(X,drop_first=True)y = df['class']from sklearn.model_selection import train_test_splitX_train, X_test, y_train, y_test = train_test_split(X, y, test_size=0.15, random_state=101)Modeling
from sklearn.ensemble import AdaBoostClassifiermodel = AdaBoostClassifier(n_estimators=1)model.fit(X_train,y_train)AdaBoostClassifier(n_estimators=1)Evaluation
from sklearn.metrics import classification_report,plot_confusion_matrix,accuracy_scorepredictions = model.predict(X_test)predictionsarray(['p', 'e', 'p', ..., 'p', 'p', 'e'], dtype=object)print(classification_report(y_test,predictions)) precision recall f1-score support
e 0.96 0.81 0.88 655
p 0.81 0.96 0.88 564
3 more lines
    accuracy                           0.88      1219
   macro avg       0.88      0.88      0.88      1219
weighted avg 0.89 0.88 0.88 1219model.feature_importances_array([0., 0., 0., 0., 0., 0., 0., 0., 0., 0., 0., 0., 0., 0., 0., 0., 0.,
0., 0., 0., 0., 0., 1., 0., 0., 0., 0., 0., 0., 0., 0., 0., 0., 0.,
0., 0., 0., 0., 0., 0., 0., 0., 0., 0., 0., 0., 0., 0., 0., 0., 0.,
0., 0., 0., 0., 0., 0., 0., 0., 0., 0., 0., 0., 0., 0., 0., 0., 0.,
0., 0., 0., 0., 0., 0., 0., 0., 0., 0., 0., 0., 0., 0., 0., 0., 0.,1 more line
0., 0., 0., 0., 0., 0., 0., 0., 0., 0.])model.feature_importances_.argmax()22X.columns[22]'odor_n'sns.countplot(data=df,x='odor',hue='class')<AxesSubplot:xlabel='odor', ylabel='count'>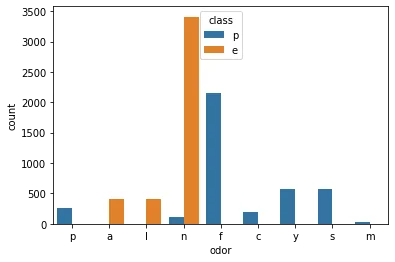
Analyzing performance as more weak learners are added.
len(X.columns)95error_rates = []
for n in range(1,96):
model = AdaBoostClassifier(n_estimators=n)
model.fit(X_train,y_train)
preds = model.predict(X_test)
err = 1 - accuracy_score(y_test,preds)
error_rates.append(err)plt.plot(range(1,96),error_rates)[<matplotlib.lines.Line2D at 0x289c33b1f70>]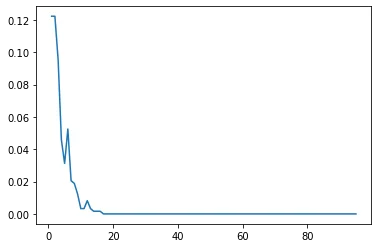
modelAdaBoostClassifier(n_estimators=95)model.feature_importances_array([0. , 0. , 0. , 0. , 0. ,
0. , 0. , 0. , 0.01052632, 0. ,
0. , 0.01052632, 0. , 0. , 0. ,
0.01052632, 0. , 0.05263158, 0.03157895, 0.03157895,
0. , 0. , 0.06315789, 0.02105263, 0. ,14 more lines
       0.        , 0.        , 0.09473684, 0.09473684, 0.        ,
       0.        , 0.        , 0.        , 0.        , 0.        ,
       0.        , 0.        , 0.        , 0.        , 0.        ,
       0.01052632, 0.01052632, 0.        , 0.        , 0.        ,
       0.06315789, 0.        , 0.        , 0.        , 0.        ,
       0.03157895, 0.        , 0.        , 0.        , 0.        ,
       0.        , 0.        , 0.        , 0.        , 0.        ,
       0.        , 0.        , 0.06315789, 0.        , 0.        ,
       0.01052632, 0.        , 0.        , 0.        , 0.        ,
       0.        , 0.01052632, 0.        , 0.        , 0.        ,
       0.        , 0.        , 0.        , 0.        , 0.        ,
       0.05263158, 0.        , 0.16842105, 0.        , 0.10526316,
       0.        , 0.        , 0.04210526, 0.        , 0.        ,
0. , 0. , 0. , 0. , 0.01052632])feats = pd.DataFrame(index=X.columns,data=model.feature_importances_,columns=['Importance'])featsImportance
cap-shape_c
0.000000
cap-shape_f
0.00000019 more lines
cap-shape_k
0.000000
cap-shape_s
0.000000
cap-shape_x
0.000000
...
...
habitat_l
0.000000
habitat_m
0.000000
habitat_p
0.000000
habitat_u
0.000000
habitat_w
0.010526
95 rows × 1 columnsimp_feats = feats[feats['Importance']>0]imp_featsImportance
cap-color_c
0.010526
cap-color_n
0.01052640 more lines
cap-color_w
0.010526
bruises_t
0.052632
odor_c
0.031579
odor_f
0.031579
odor_n
0.063158
odor_p
0.021053
gill-spacing_w
0.094737
gill-size_n
0.094737
stalk-shape_t
0.010526
stalk-root_b
0.010526
stalk-surface-above-ring_k
0.063158
stalk-surface-below-ring_y
0.031579
stalk-color-below-ring_n
0.063158
stalk-color-below-ring_w
0.010526
ring-number_t
0.010526
spore-print-color_r
0.052632
spore-print-color_w
0.168421
population_c
0.105263
population_v
0.042105
habitat_w
0.010526imp_feats = imp_feats.sort_values("Importance")plt.figure(figsize=(14,6),dpi=200)
sns.barplot(data=imp_feats.sort_values('Importance'),x=imp_feats.sort_values('Importance').index,y='Importance')
plt.xticks(rotation=90);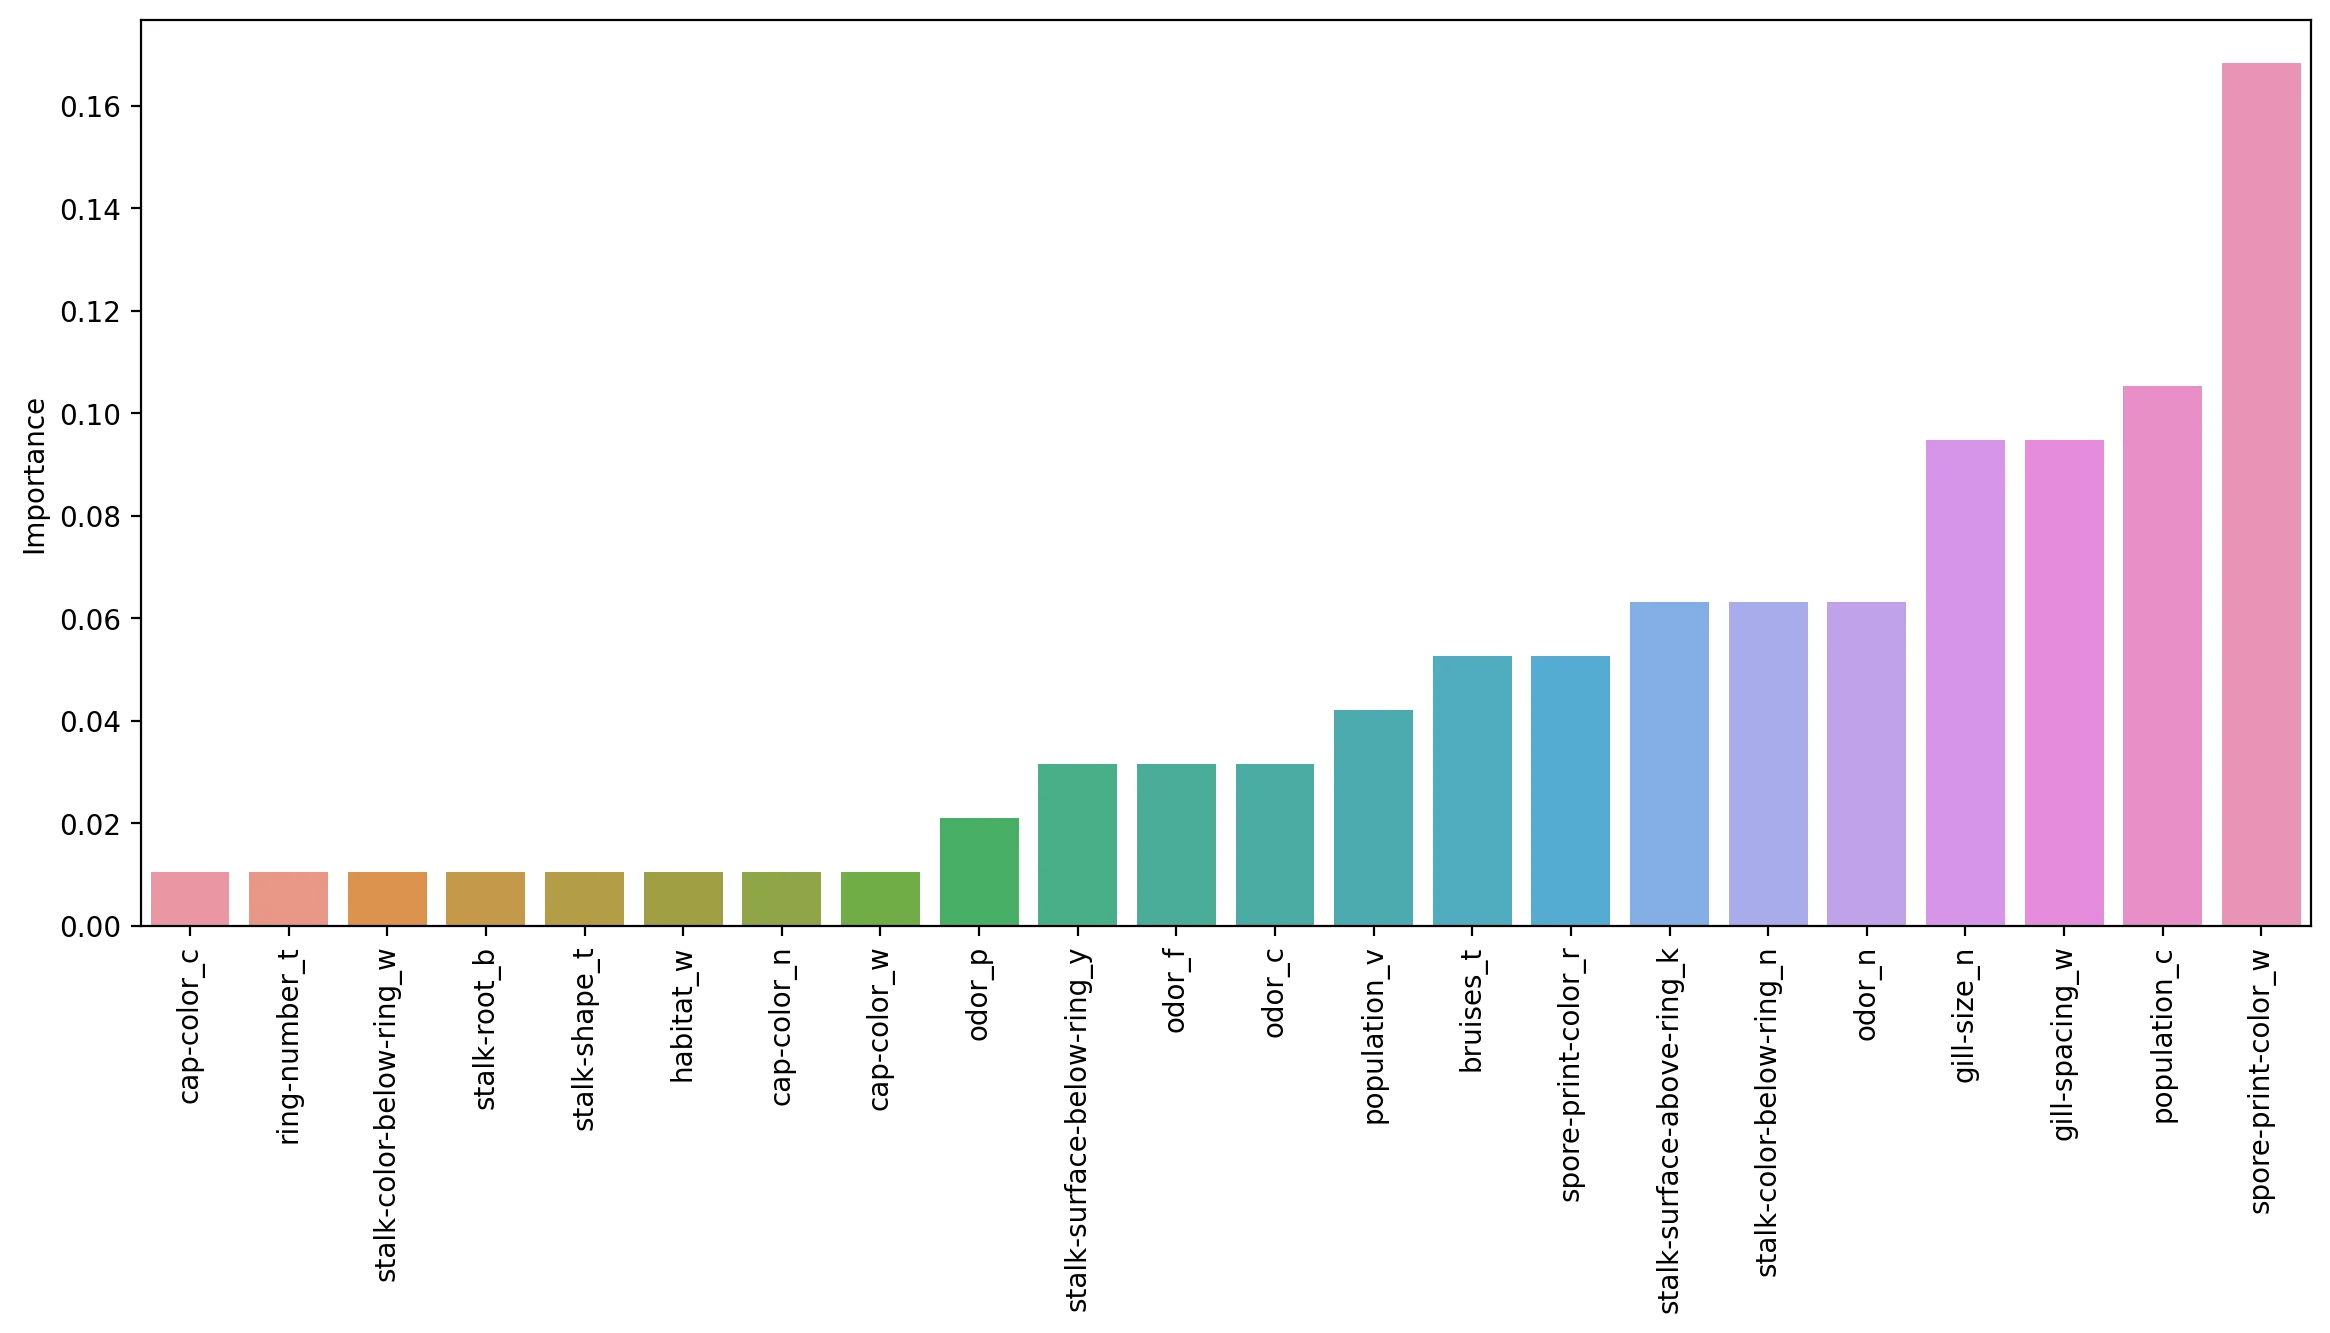
sns.countplot(data=df,x='habitat',hue='class')<AxesSubplot:xlabel='habitat', ylabel='count'>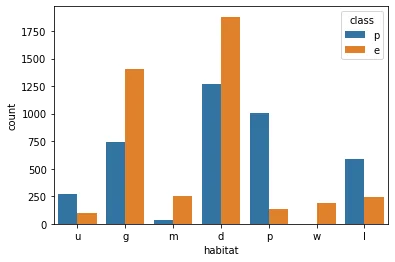
Interesting to see how the importance of the features shift as more are allowed to be added in! But remember these are all weak learner stumps, and feature importance is available for all the tree methods!